Cece's March 2024 Market Update

Cece's March 2024 Market Update

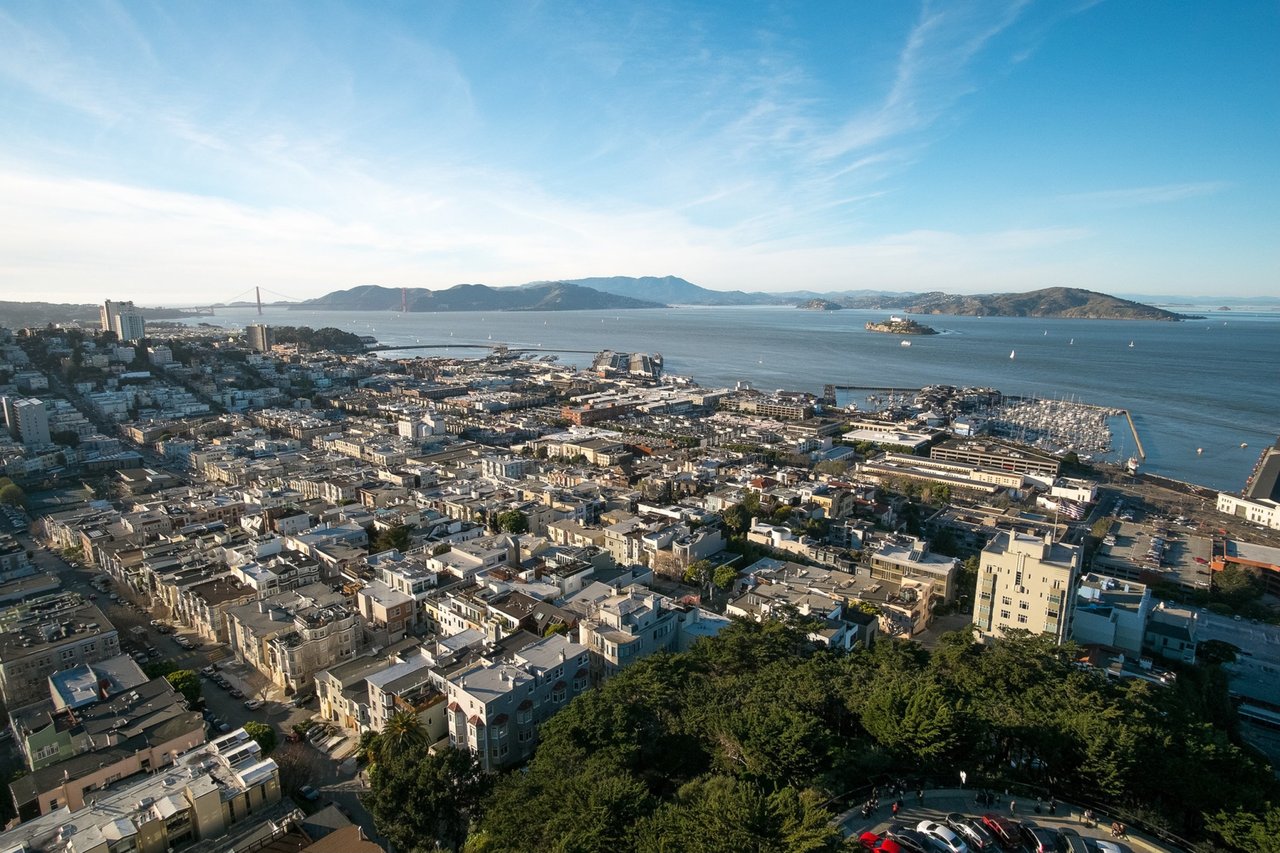
There is a growing sense that in 2023 San Francisco hit its post-pandemic low – economically, socially, and certainly in media coverage – and that it has now begun a significant recovery on all those fronts. Most importantly, confidence is rebounding in San Francisco’s future as a financial and cultural center, as the heart, along with Silicon Valley, of the next big technology boom (AI), and simply as one of the great cities of the world. 

Along with substantial macroeconomic improvements in interest rates (though they ticked up a little in February), financial markets – which recently hit all-time highs – and consumer confidence, these factors are also triggering a recovery in its housing market. This is now beginning to show up across a wide variety of indicators as we move into the spring selling season, typically the most active of the year. 
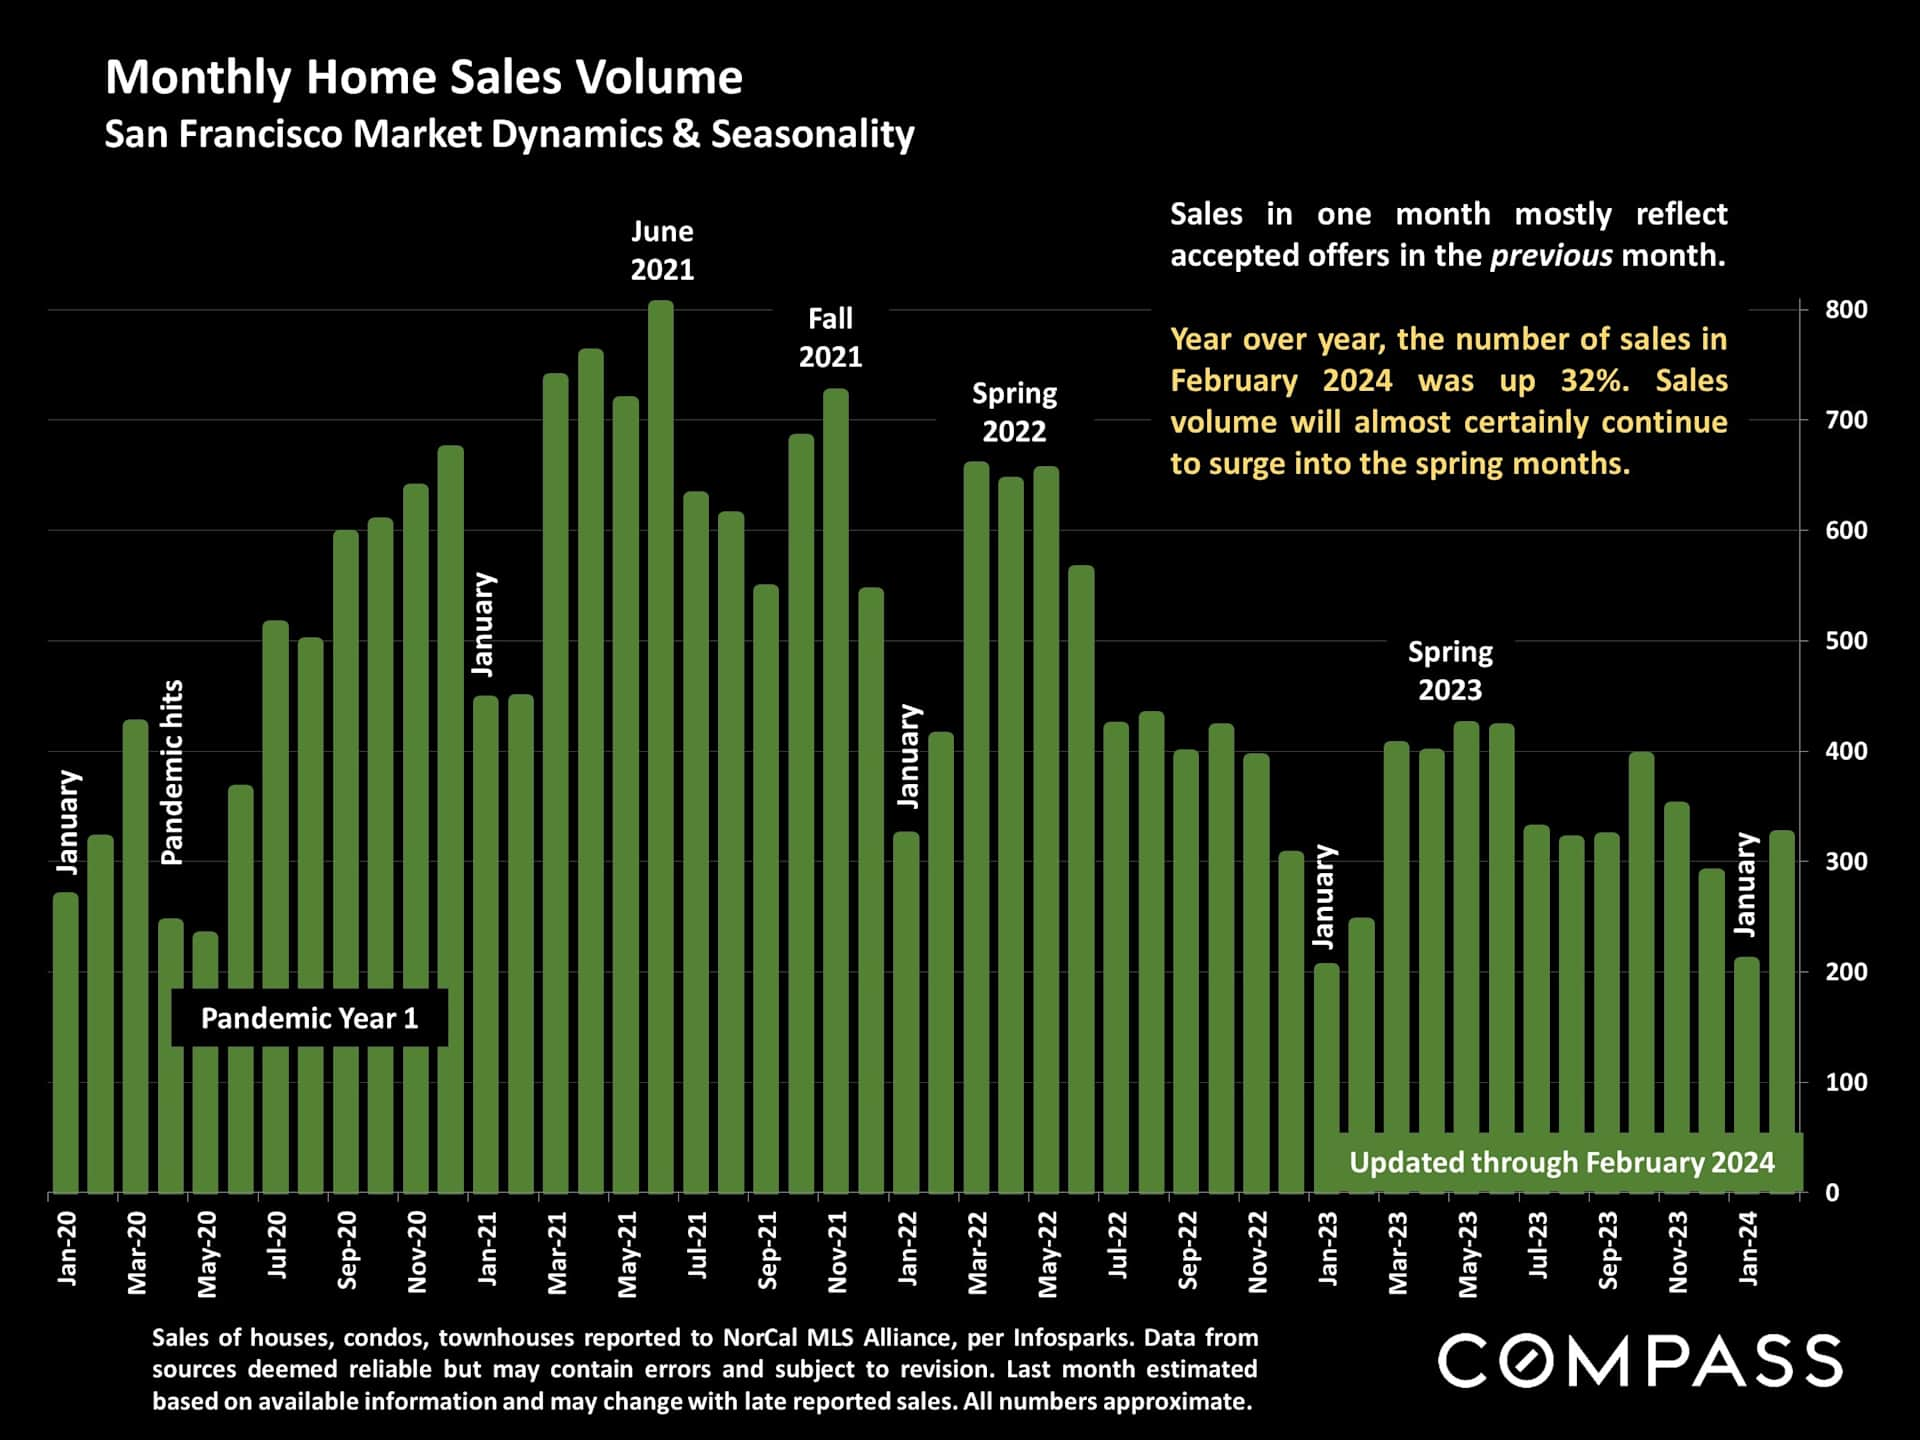
Chart of San Francisco monthly home sales through February 2024, with green bars showing pandemic-era highs and seasonal trends.

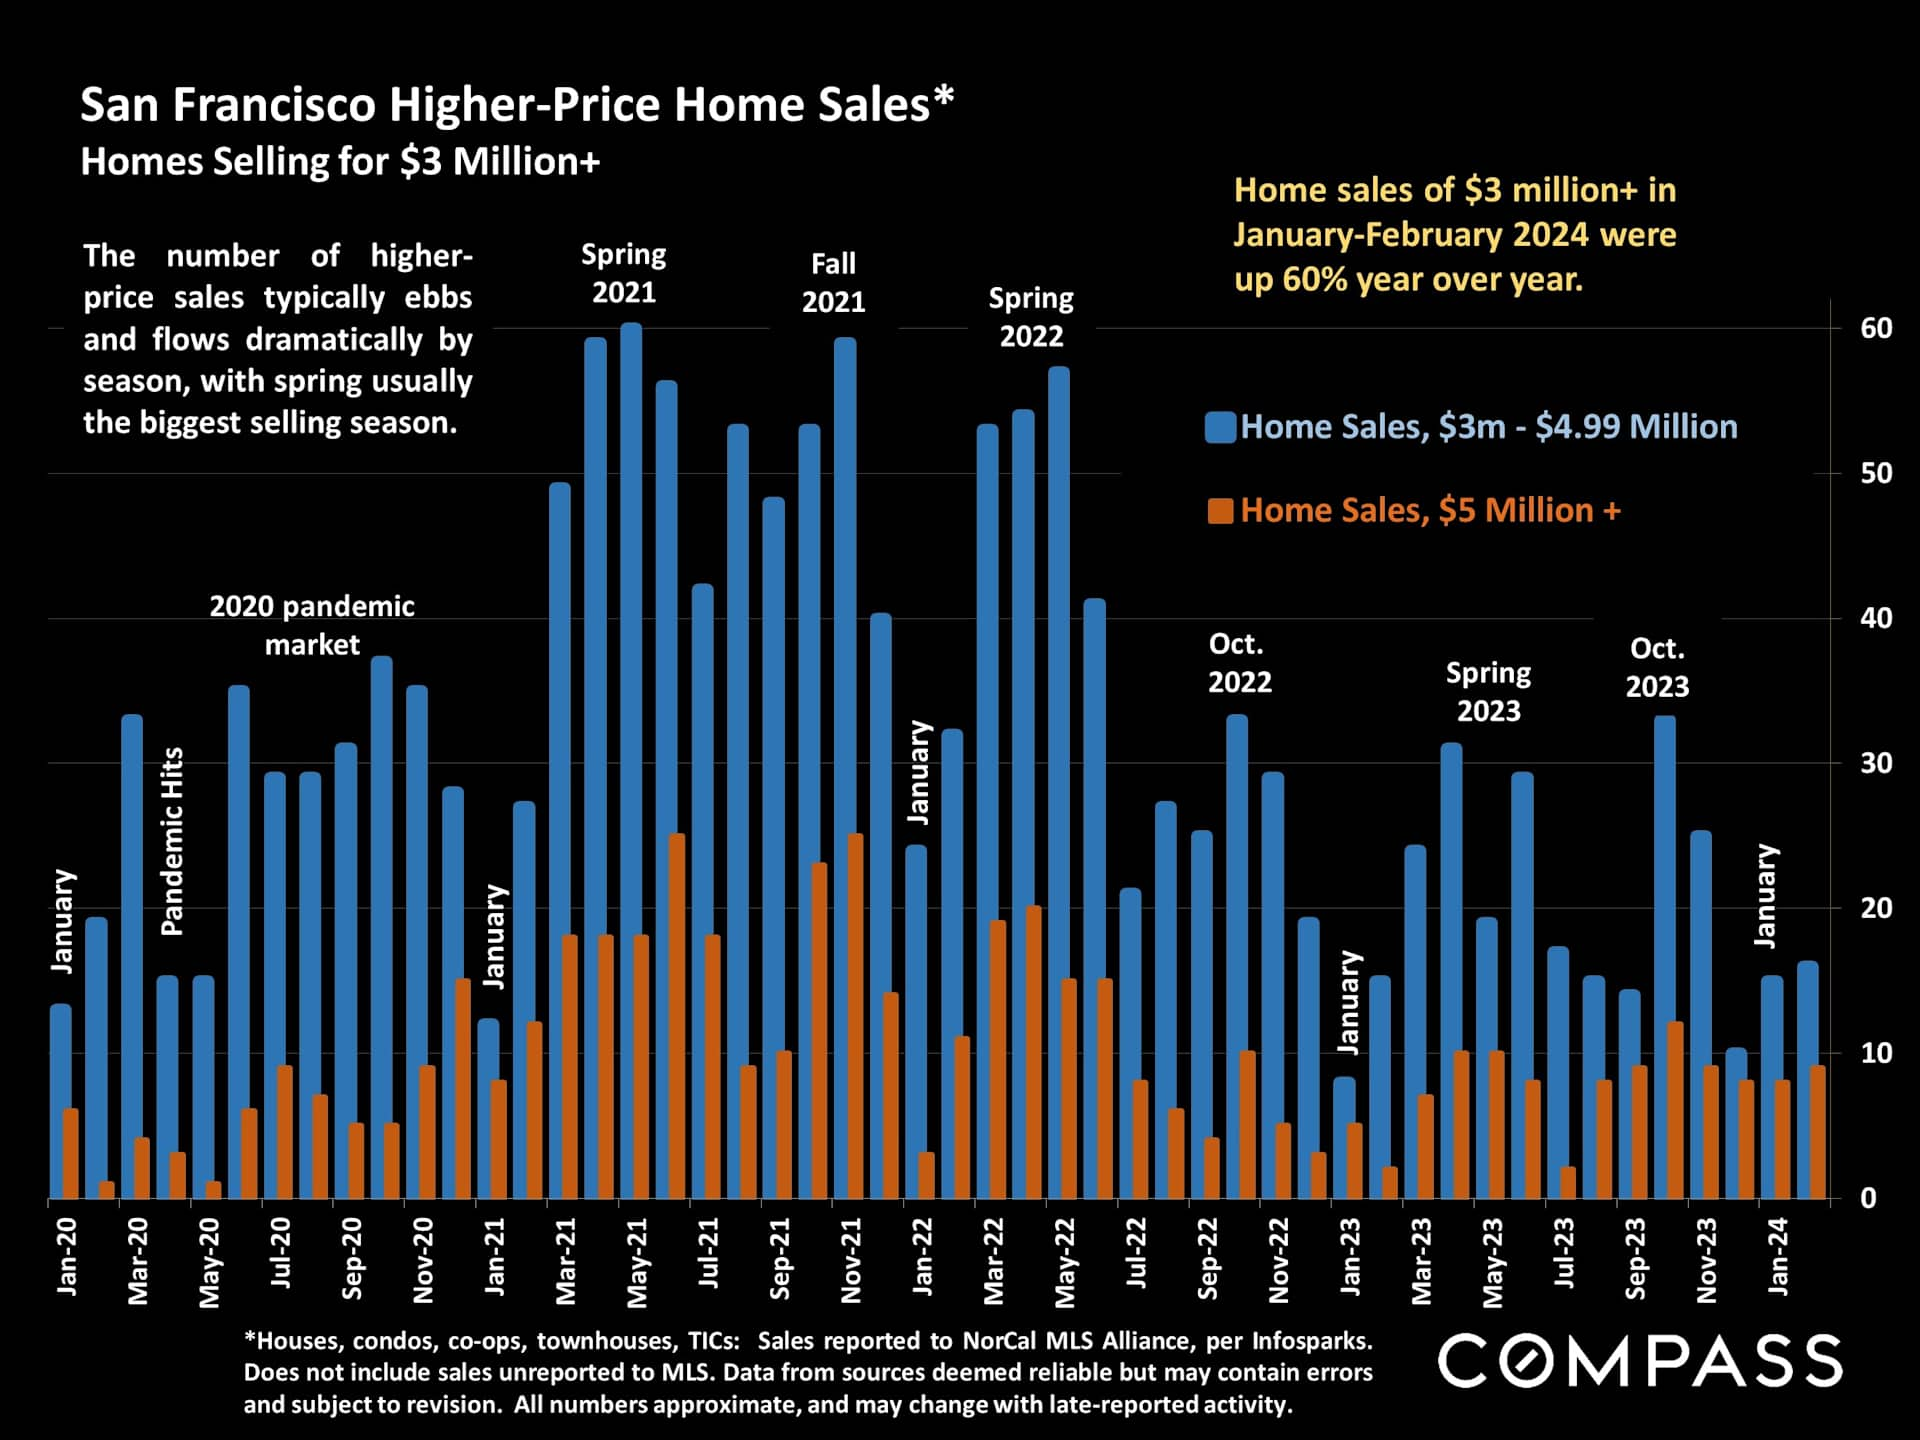
Chart of San Francisco homes selling for $3 million or more, with monthly sales from 2020 to January 2024.

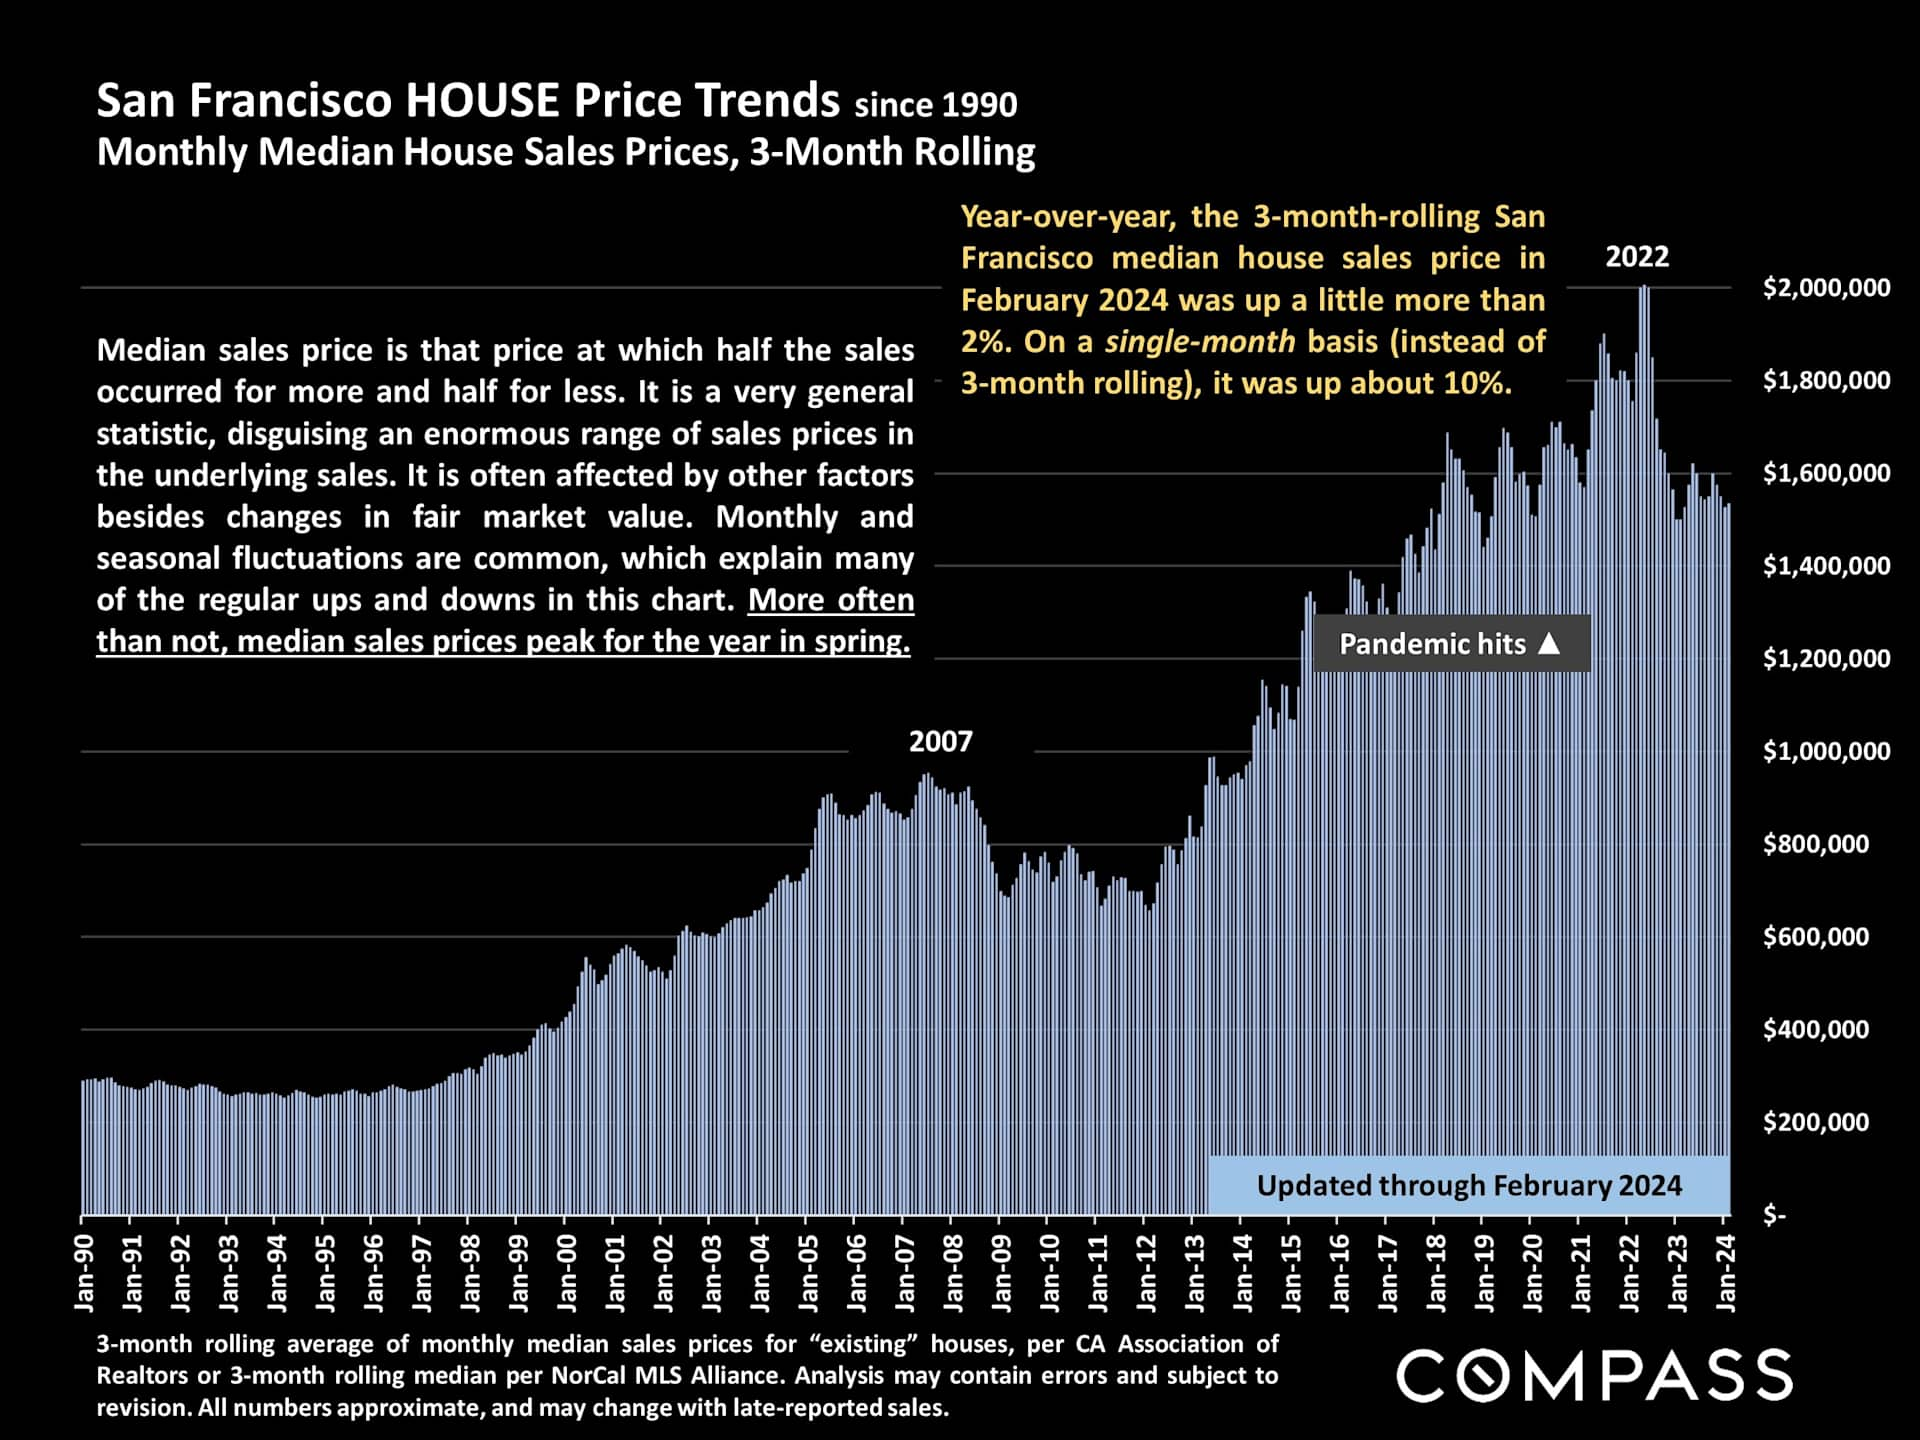
Chart of San Francisco median house prices from 1990 through February 2024, with prices peaking near $2 million in 2022.

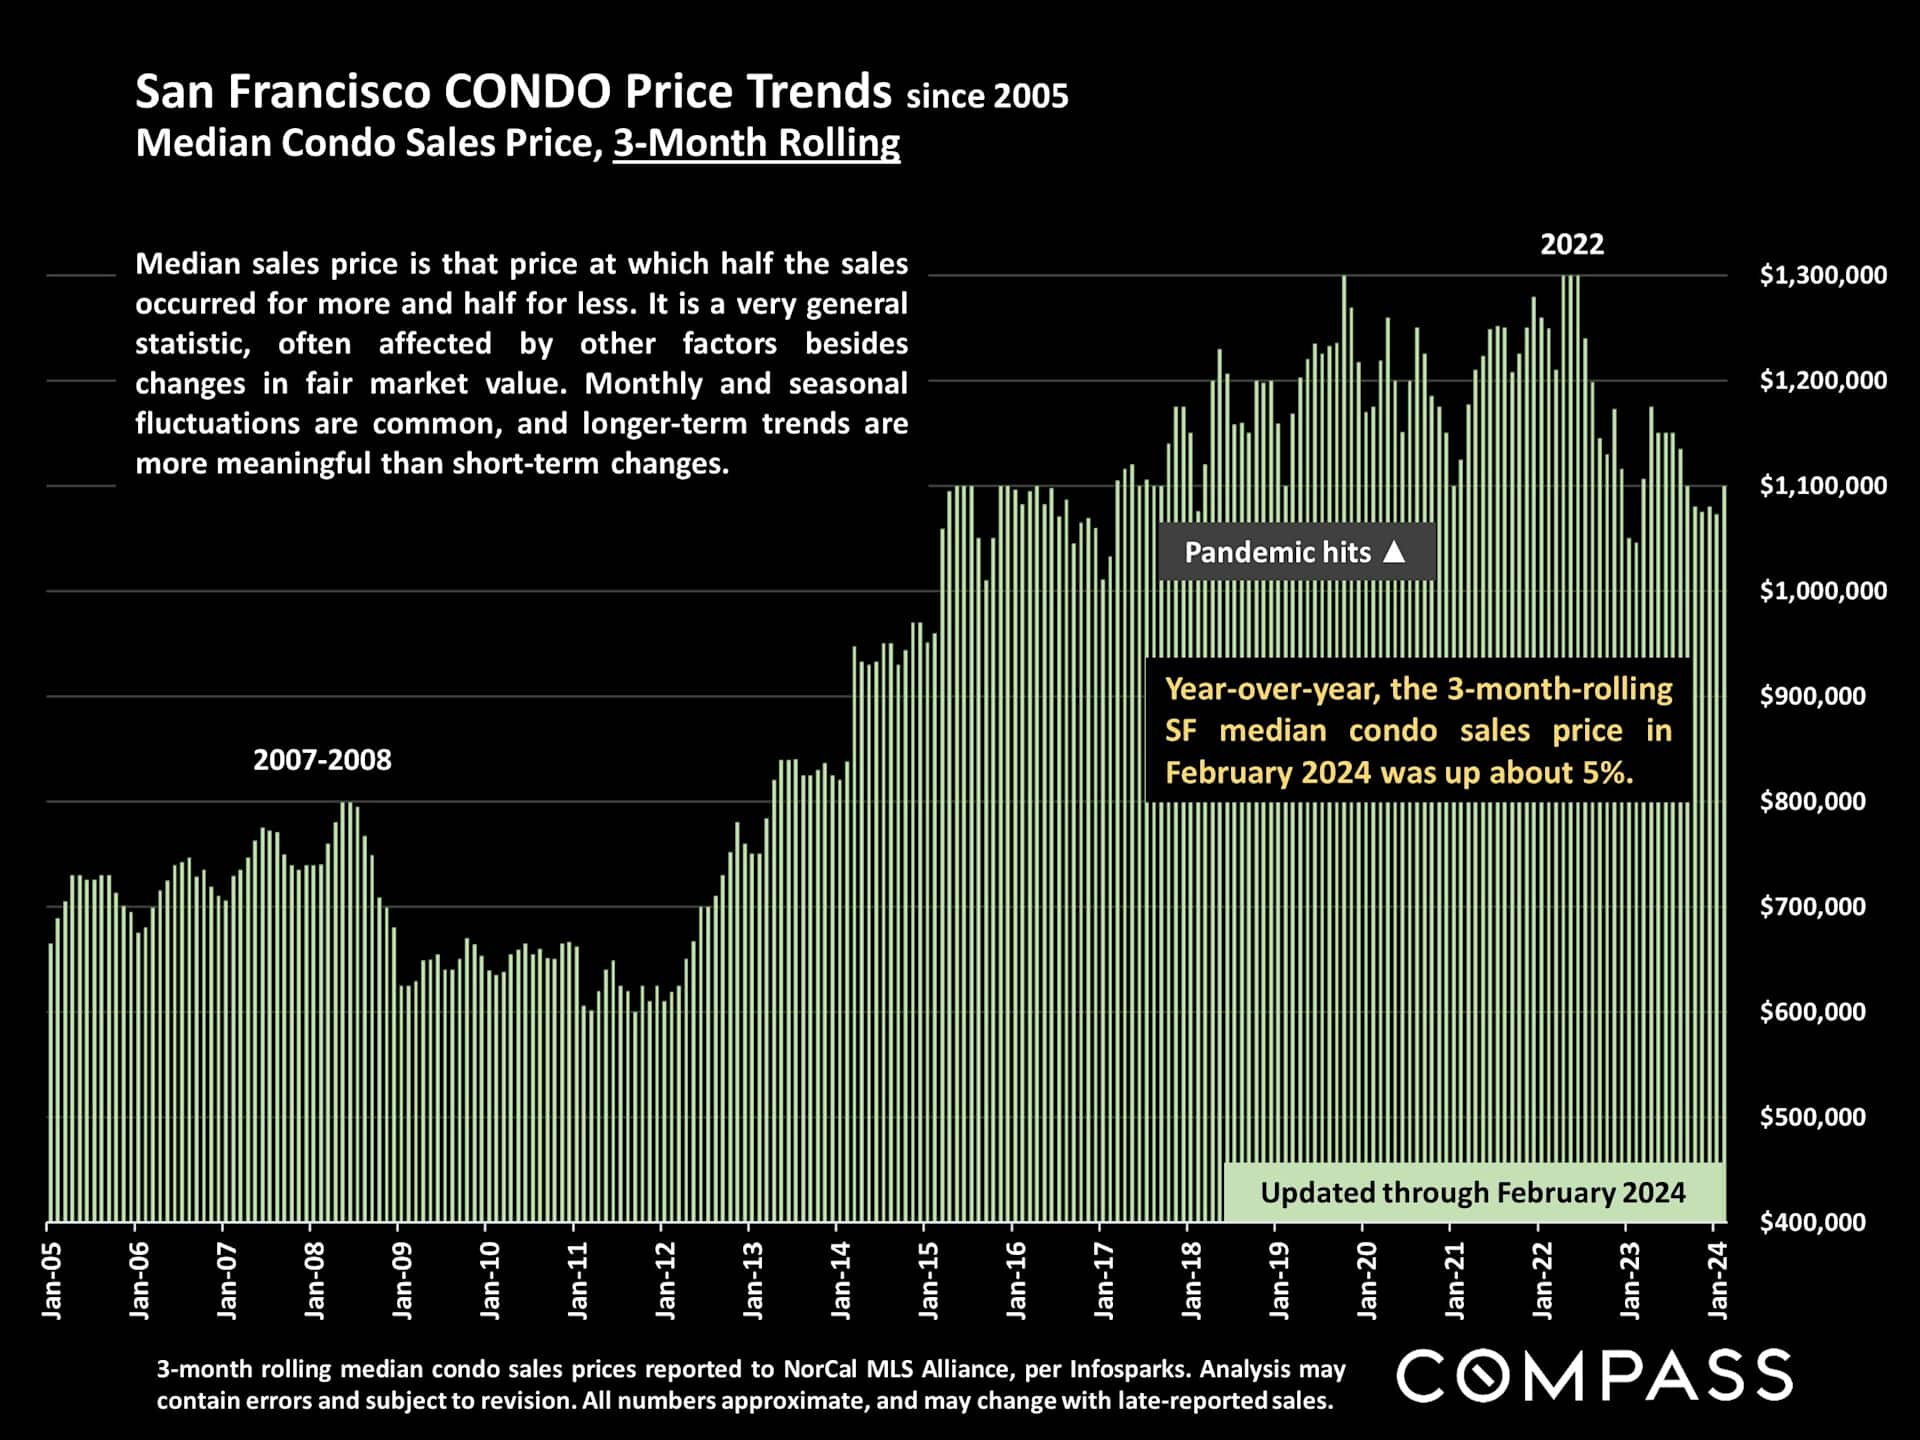
San Francisco condo price trend chart, with median prices through February 2024 and a 5% year-over-year increase.

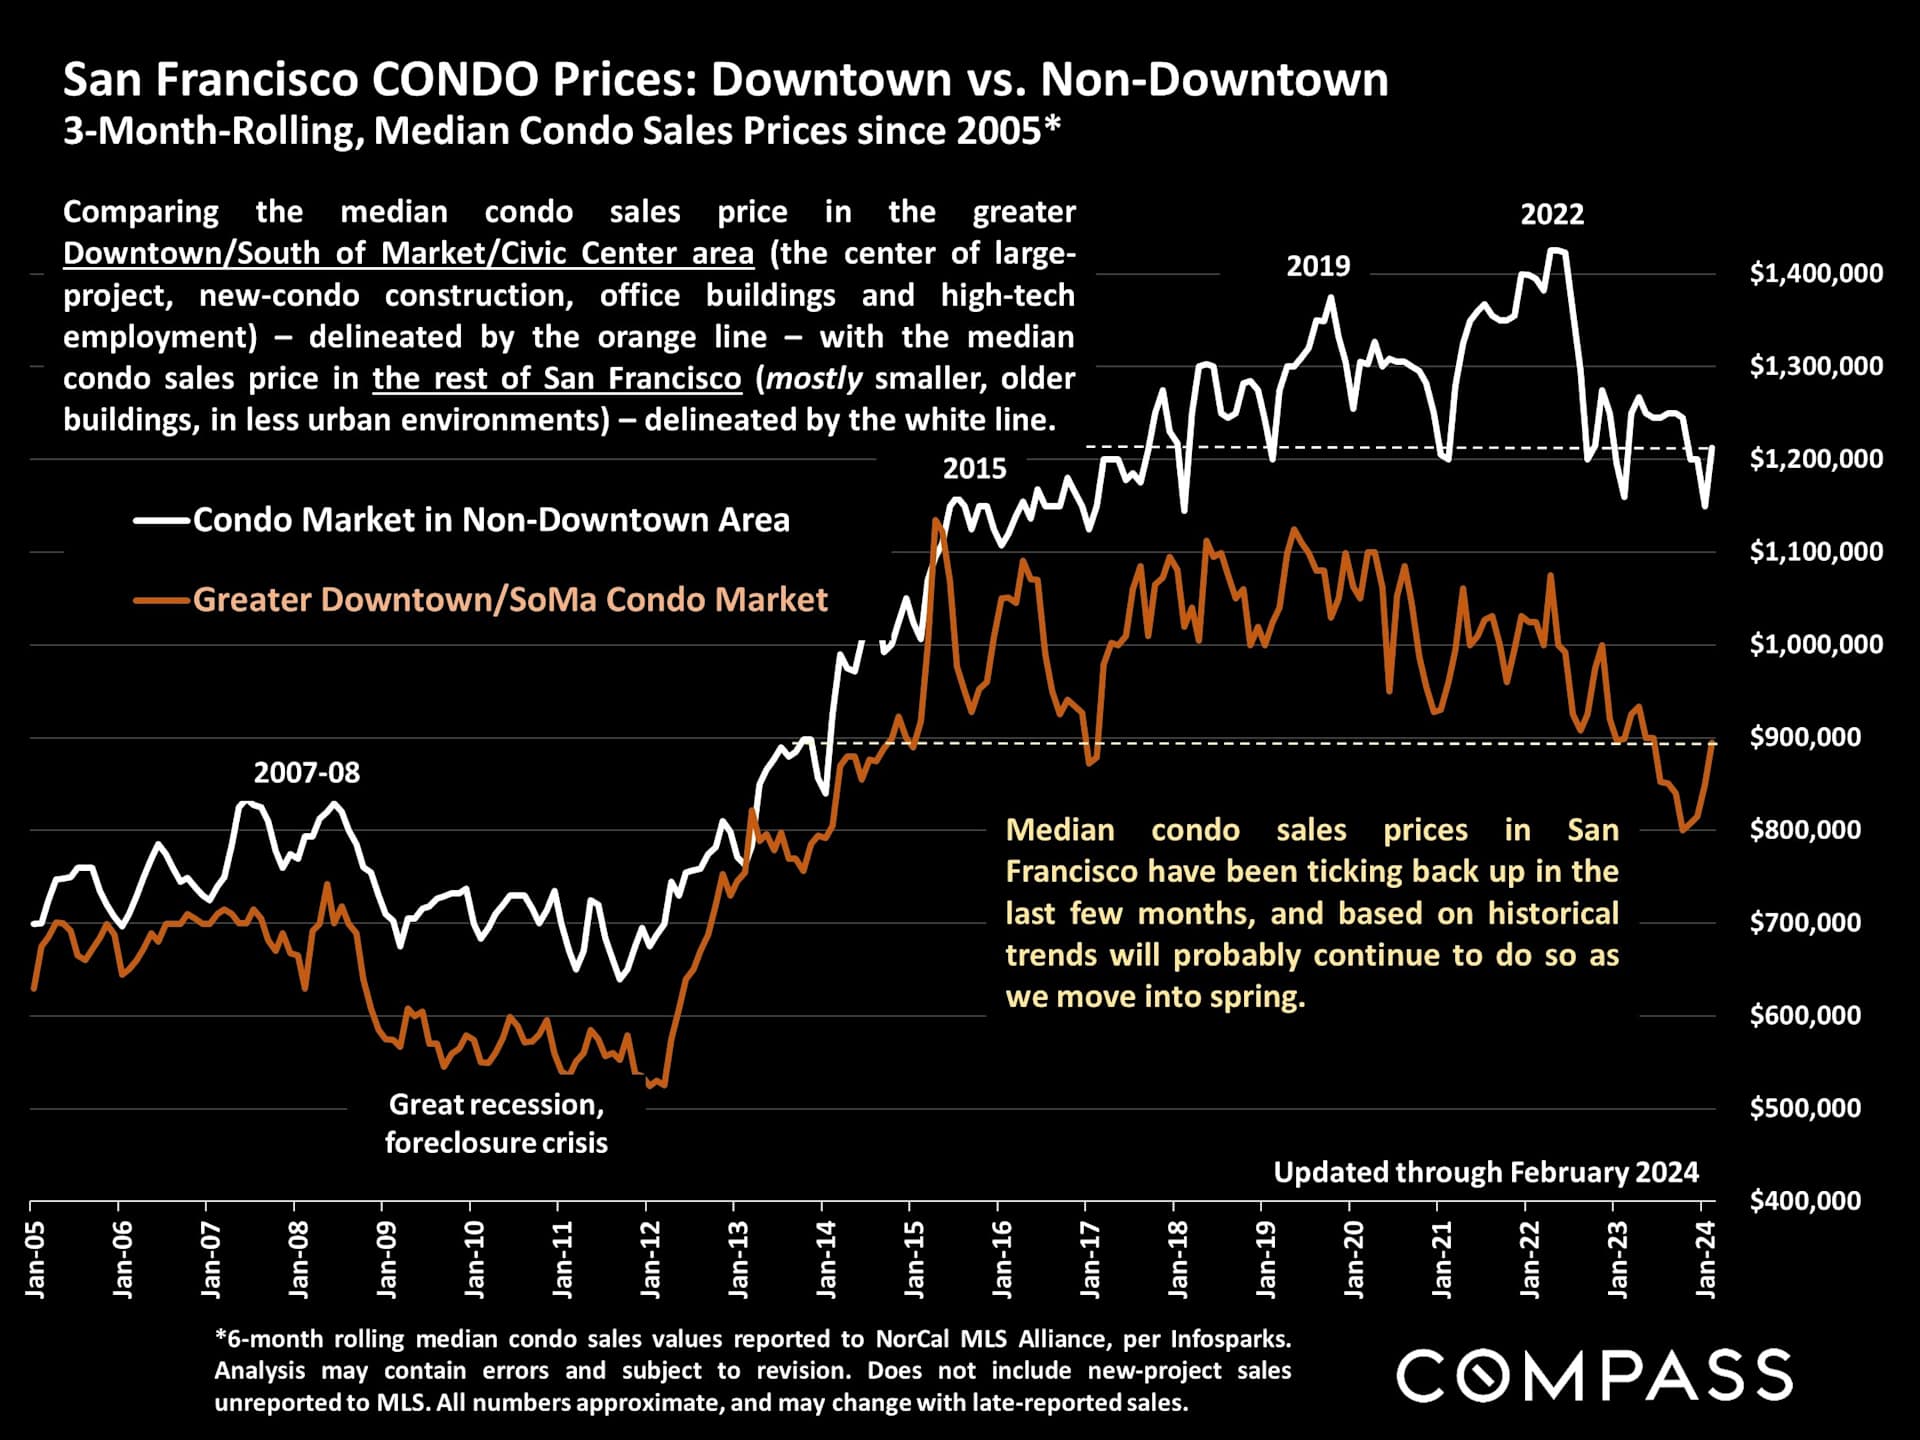
Chart comparing San Francisco downtown and non-downtown median condo prices from 2005 through February 2024.

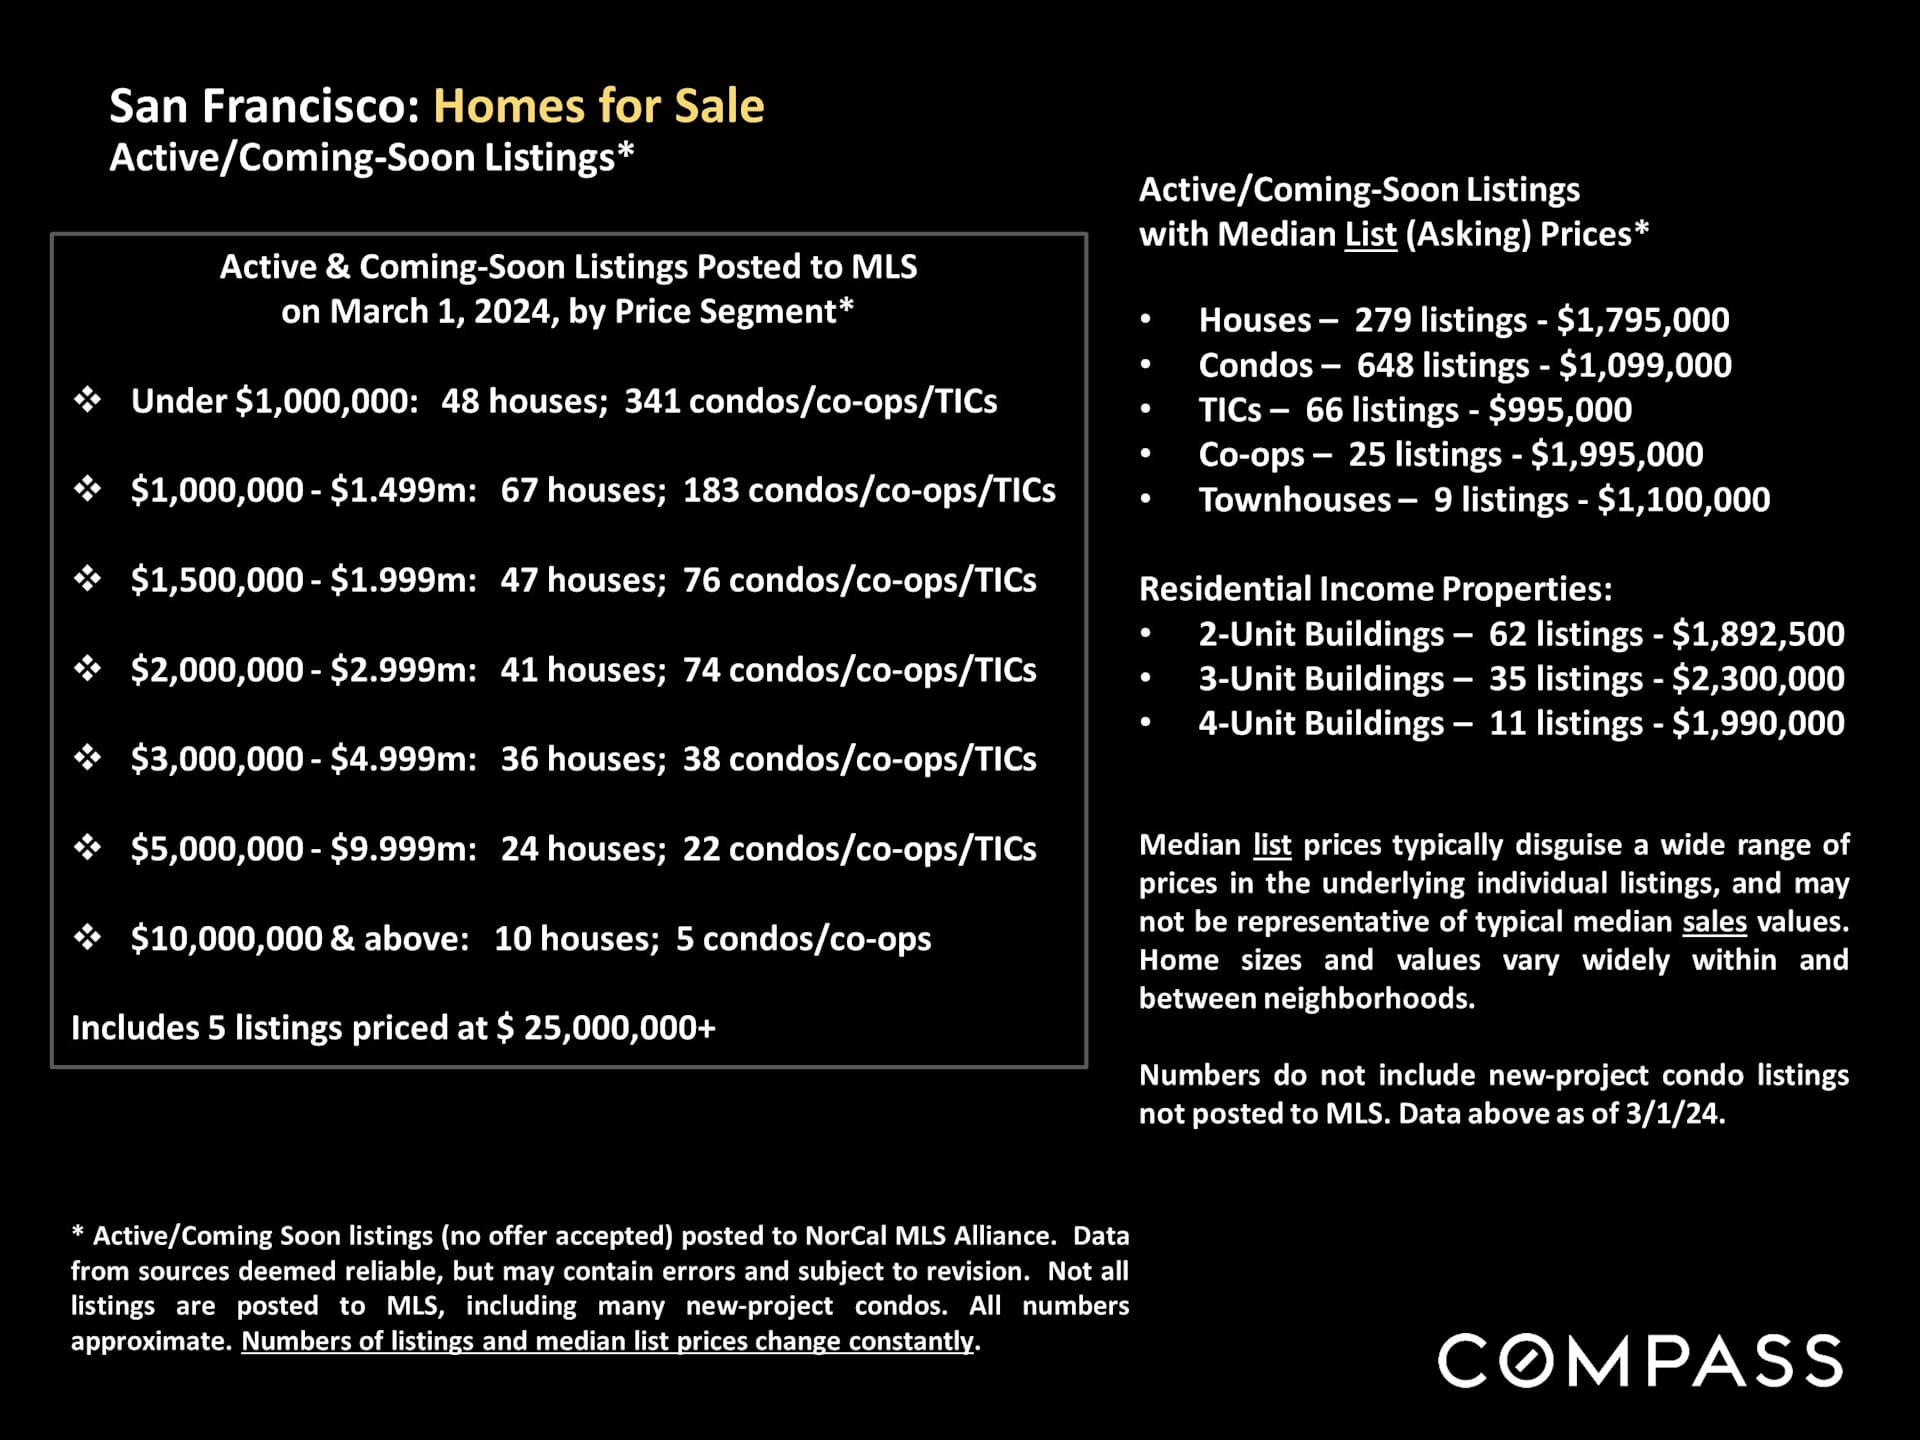
San Francisco March 2024 home listing counts by price range and median asking prices by property type.

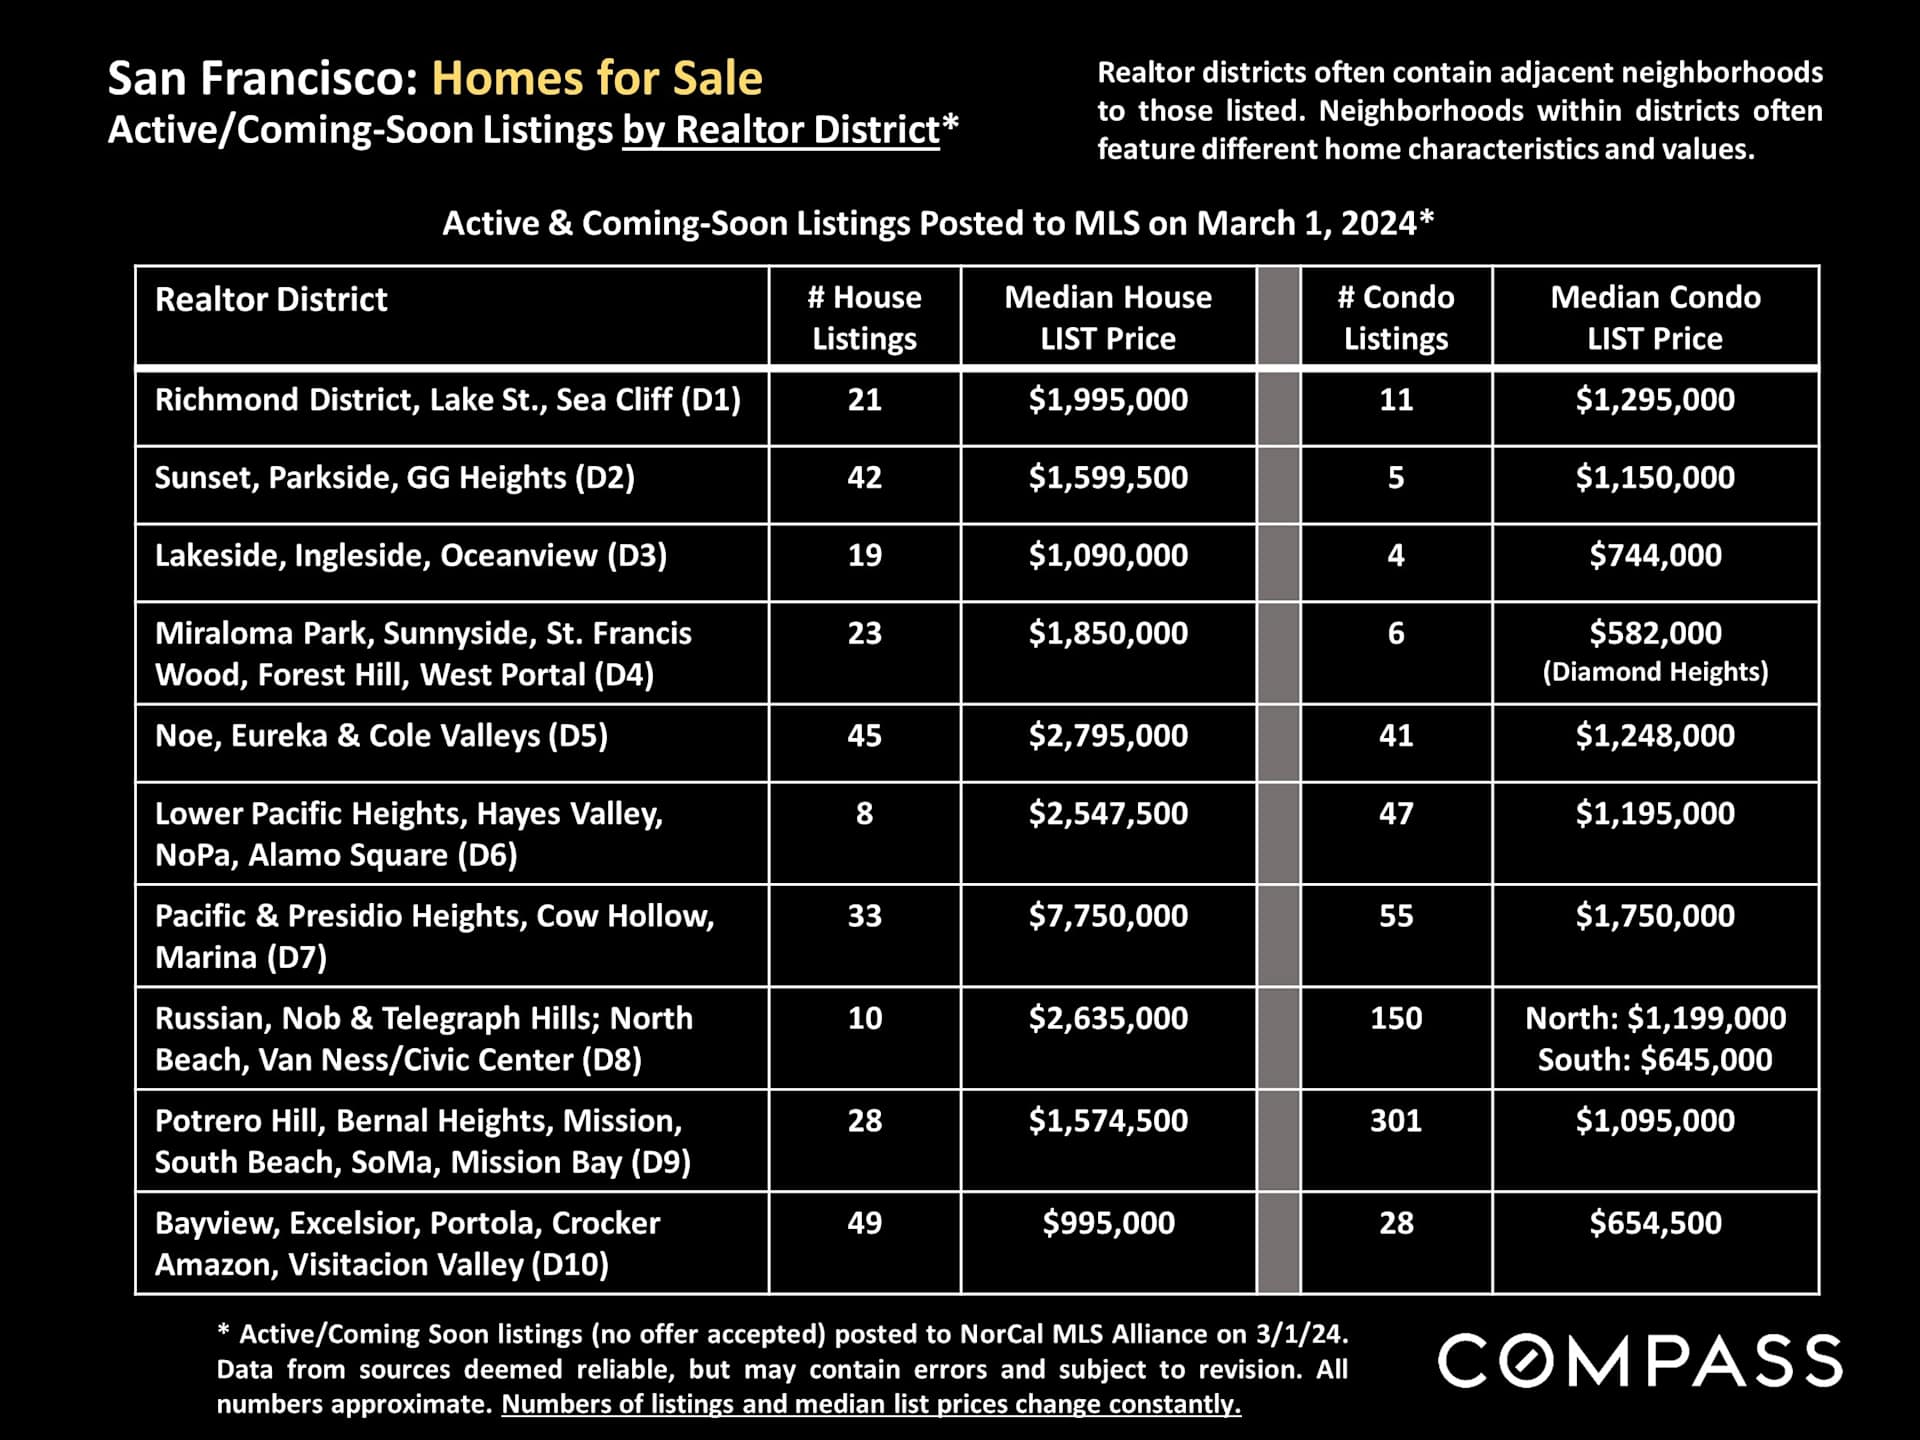
San Francisco home and condo listings and median prices by Realtor district, March 2024.

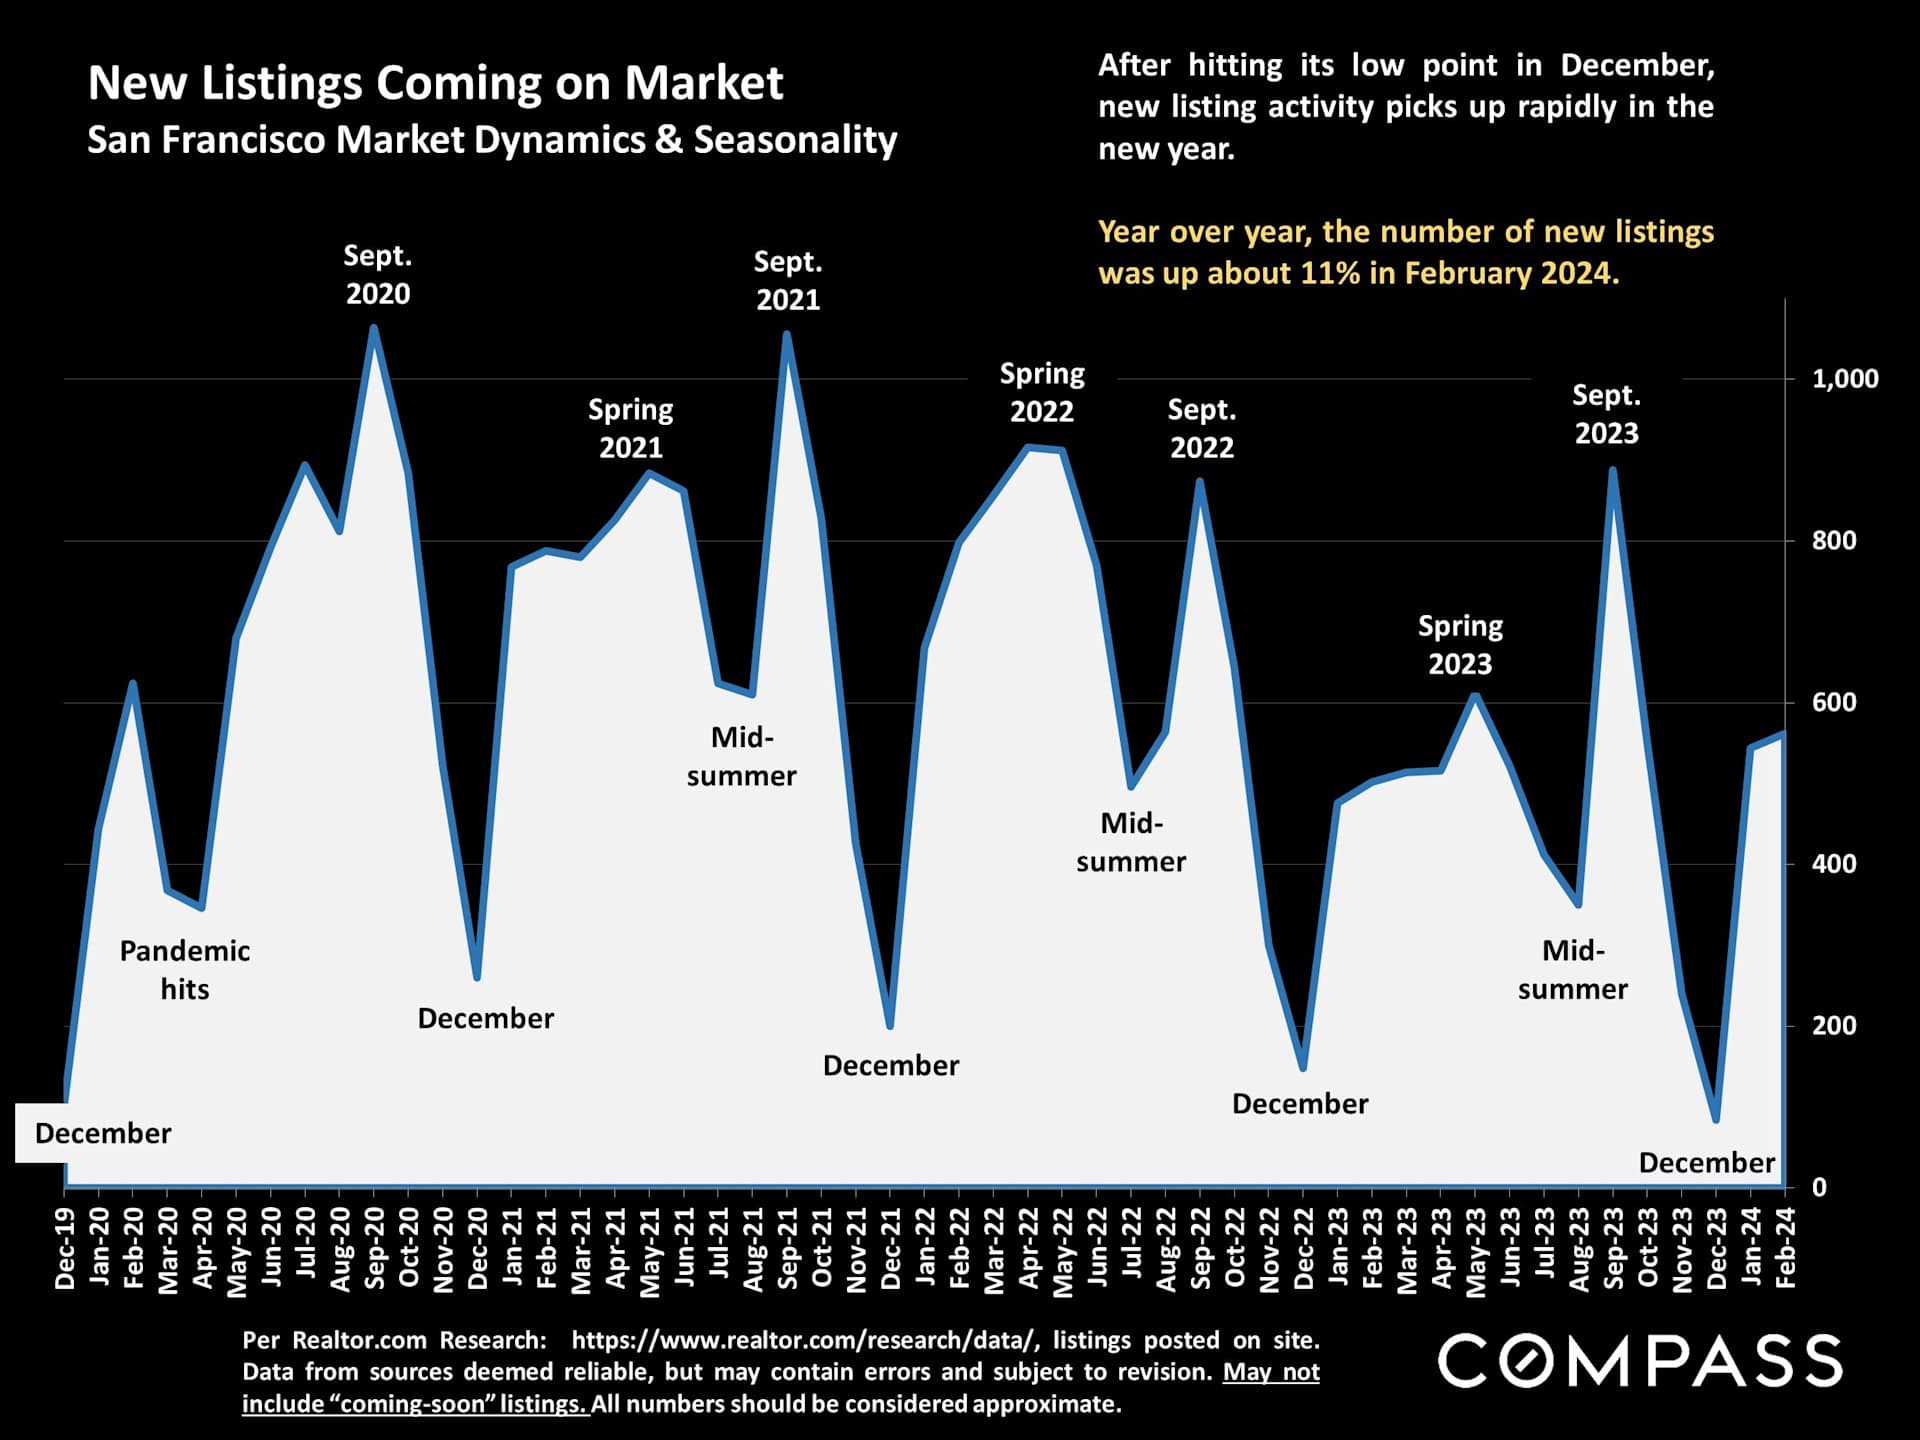
Chart of San Francisco new listings, showing seasonal peaks and a February 2024 year-over-year increase.

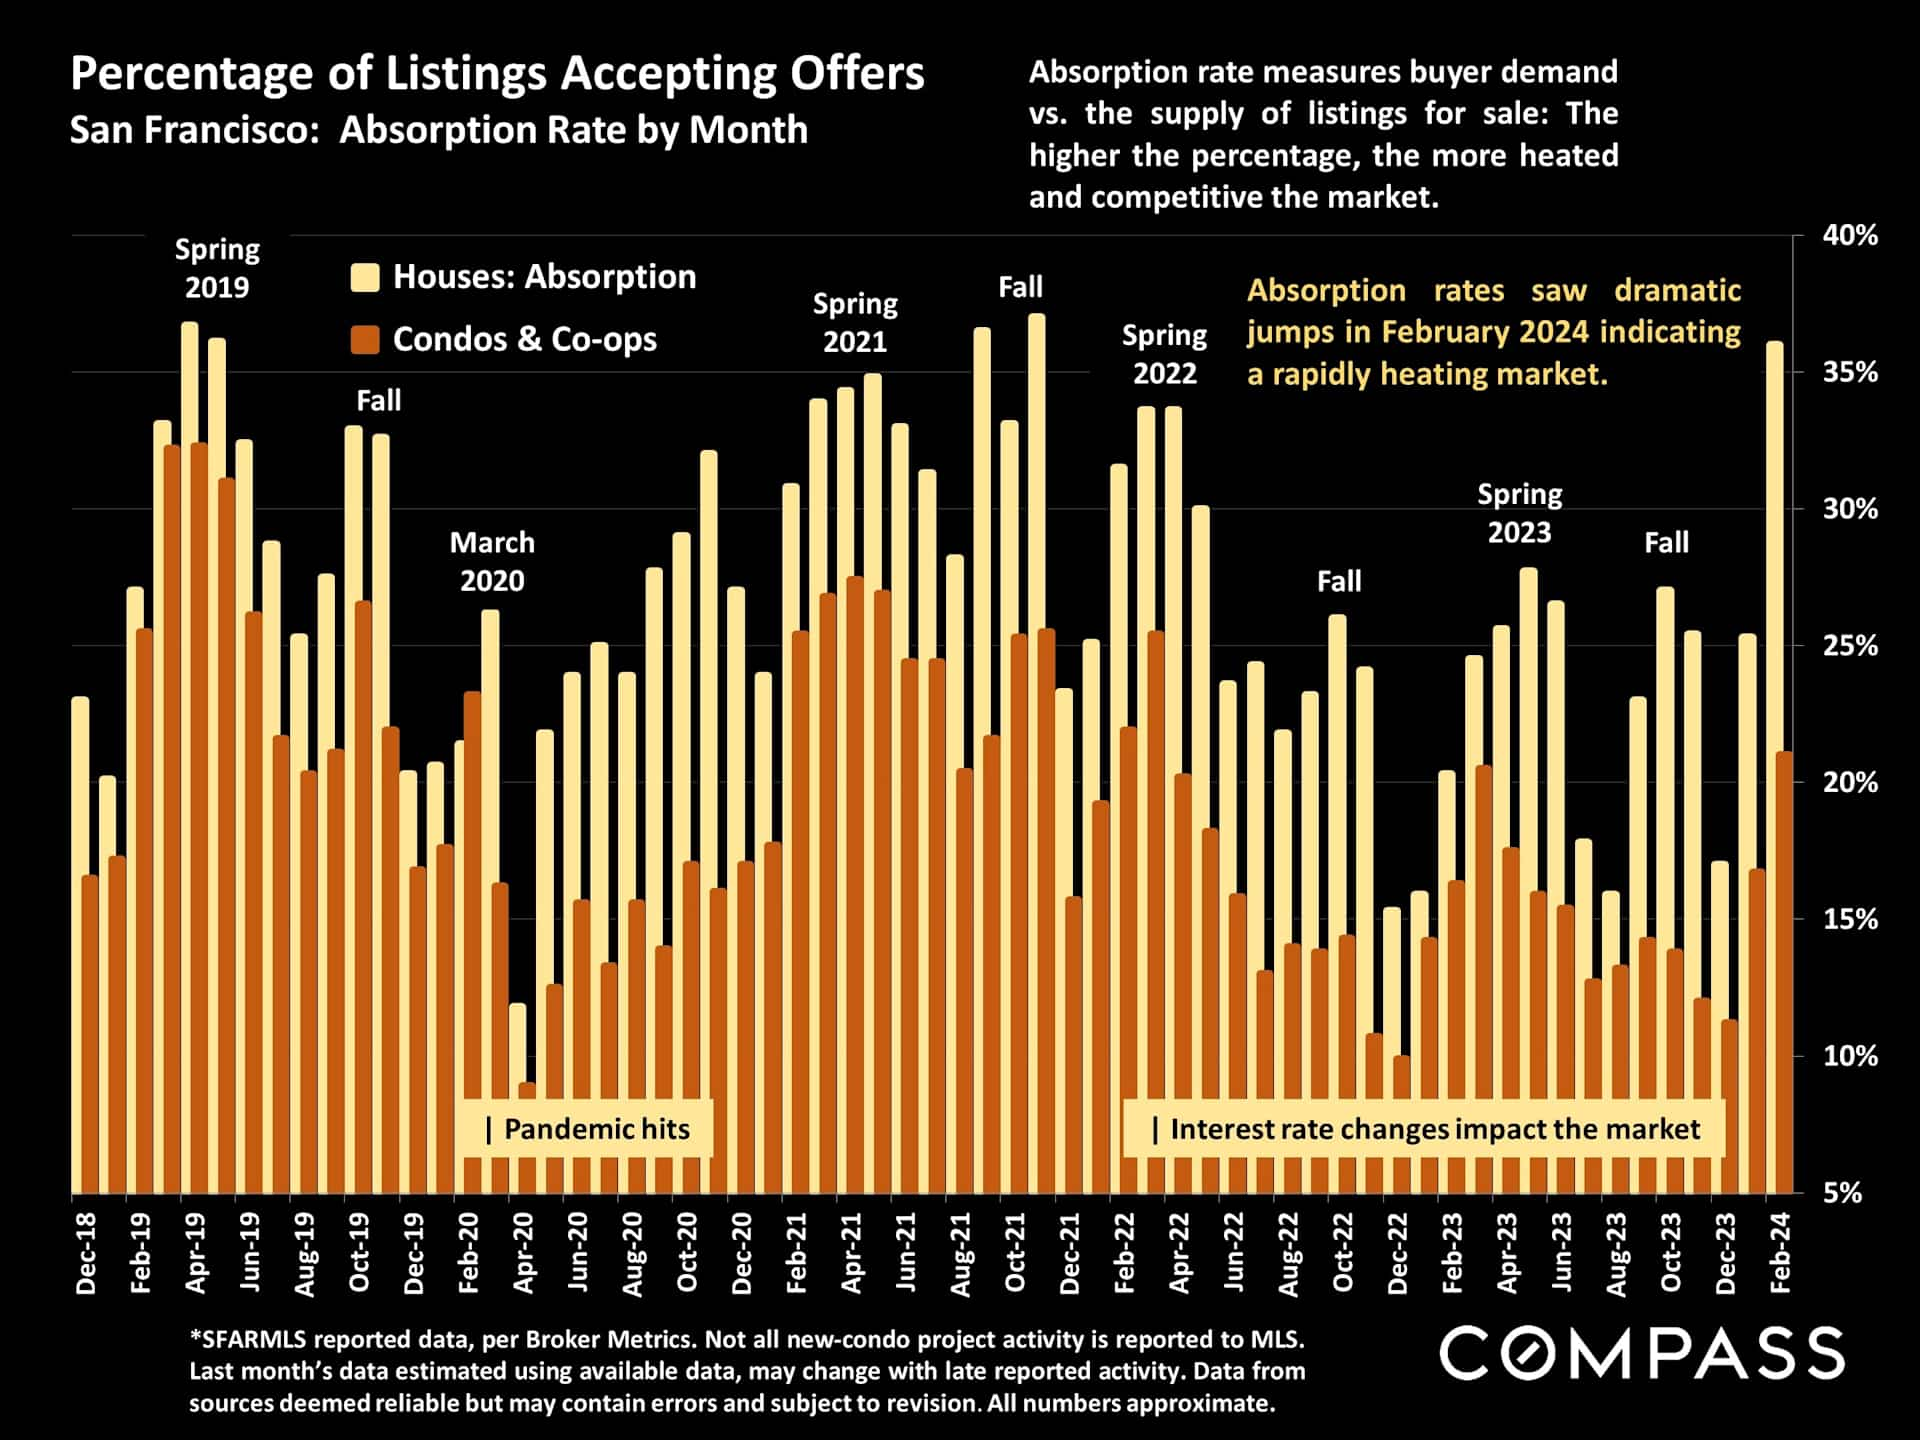
San Francisco monthly absorption-rate chart for houses and condos, with a February 2024 market-jump annotation.

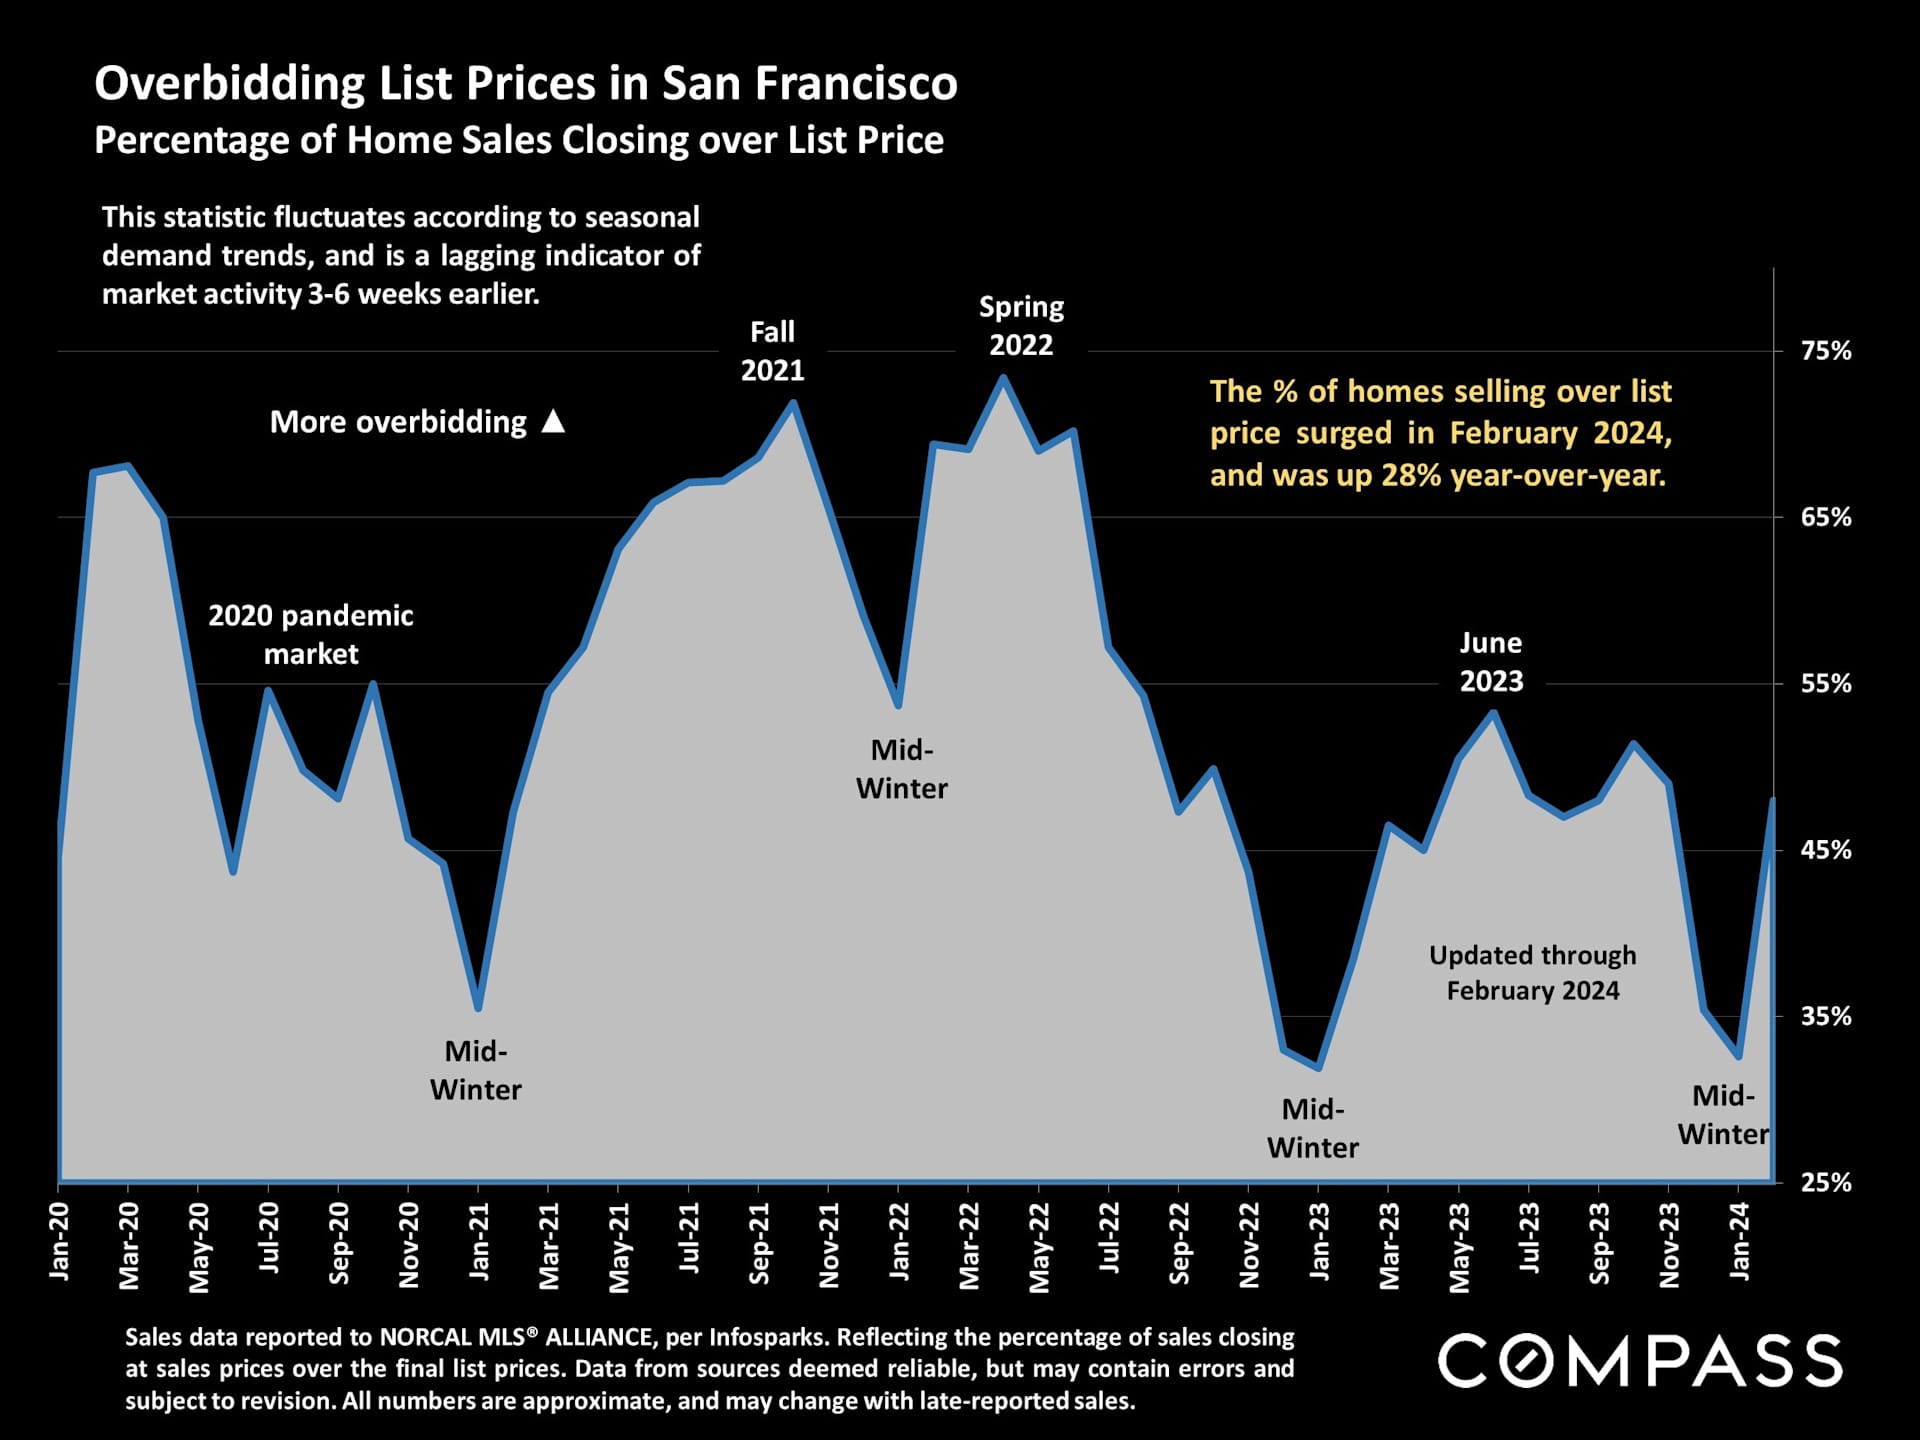
San Francisco chart of home sales closing over list price, with a February 2024 year-over-year increase of 28%.

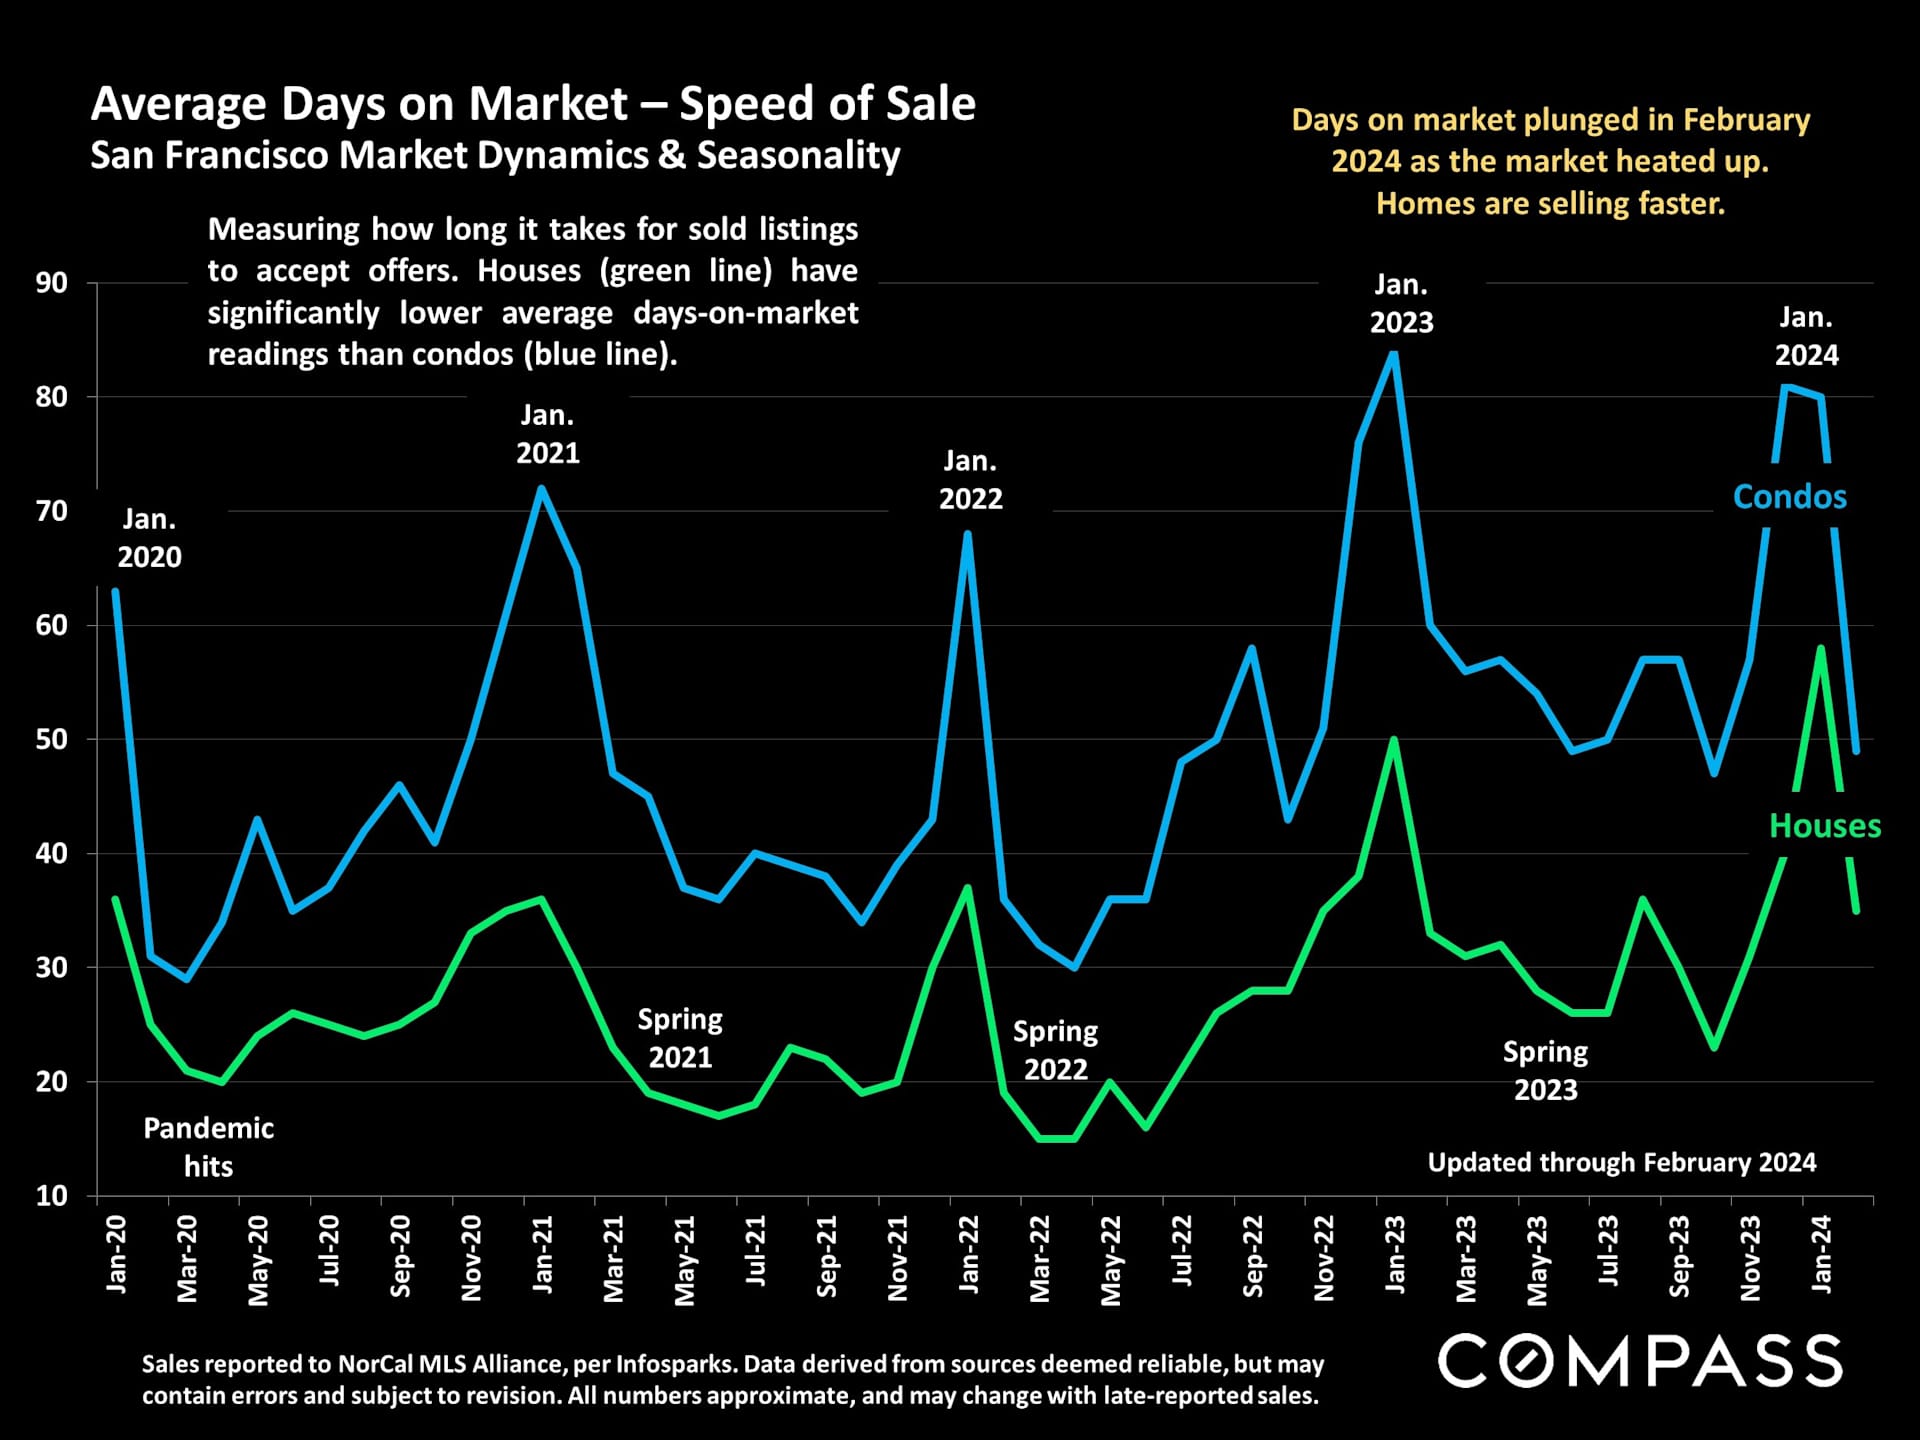
San Francisco days-on-market chart, comparing houses and condos from 2020 to 2024.

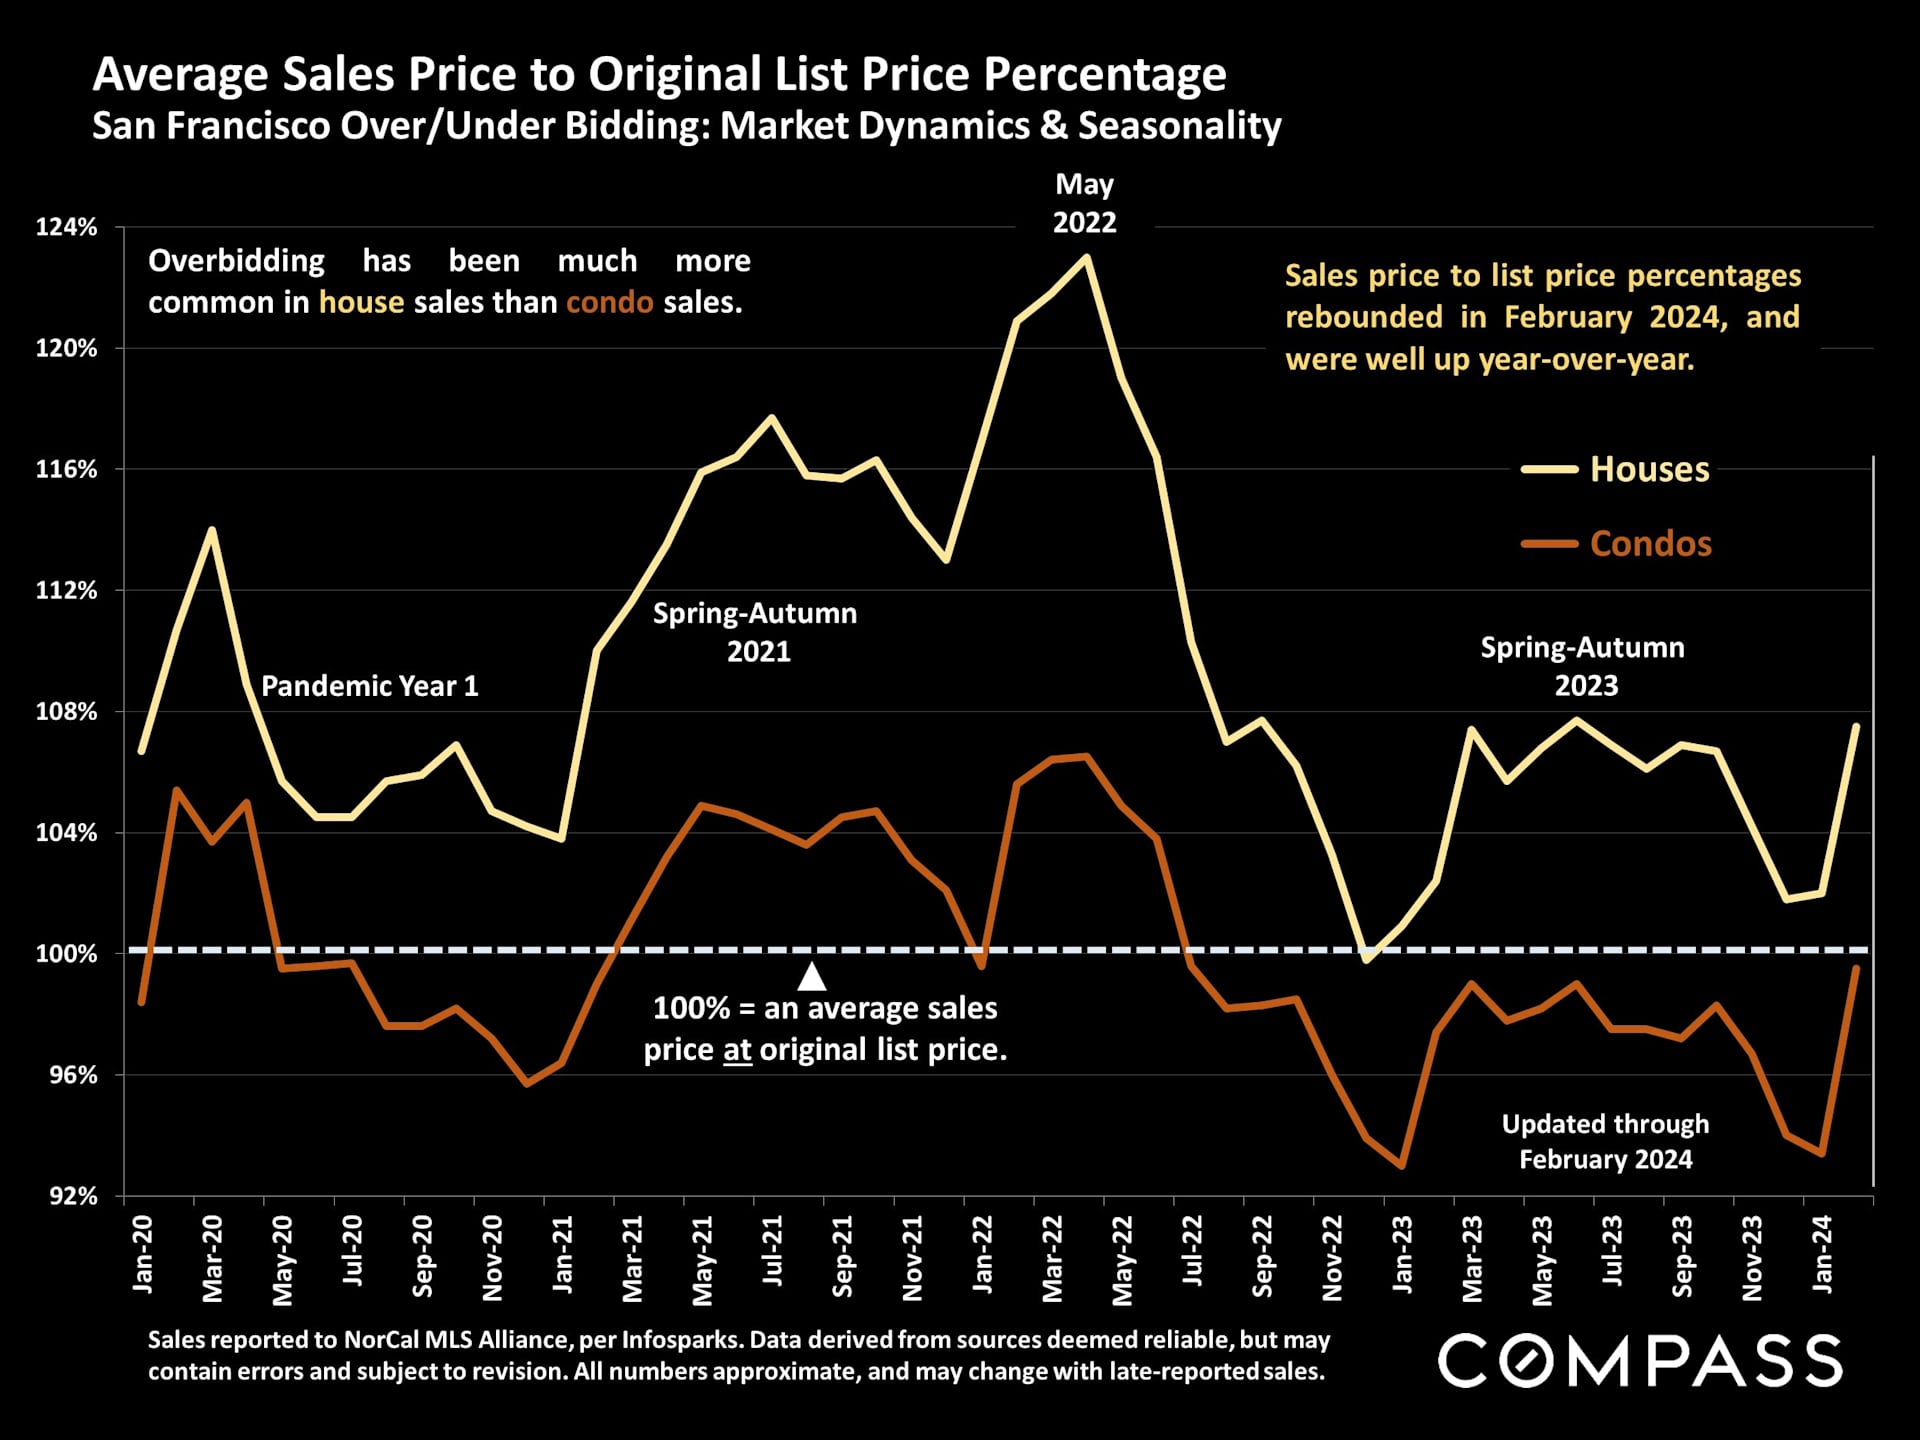
San Francisco chart comparing house and condo sale prices to original list prices from 2020 through February 2024.

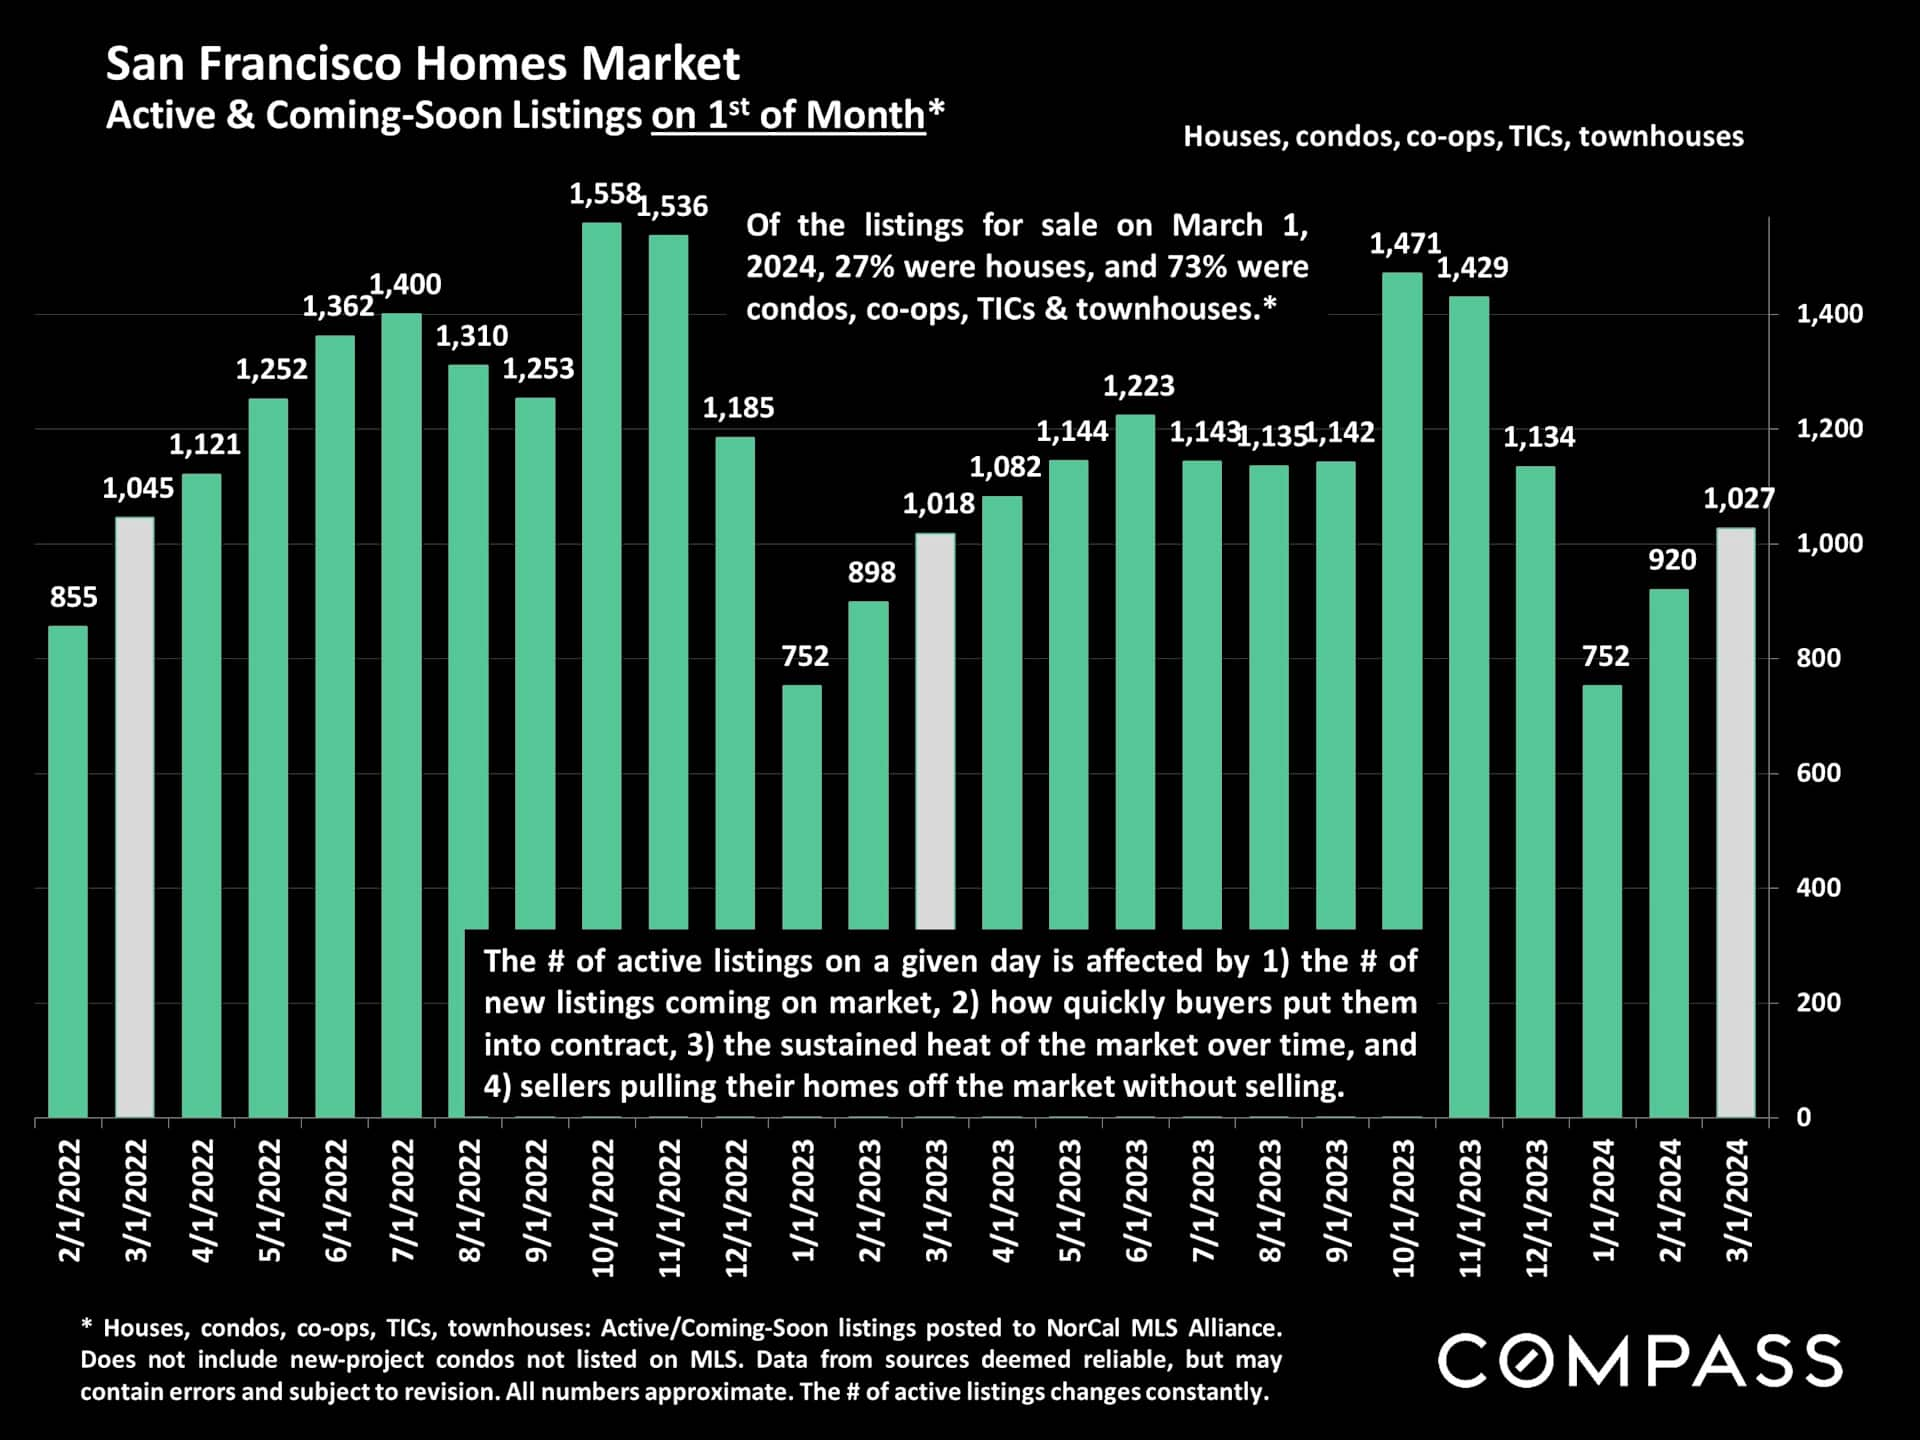
Chart of San Francisco active and coming-soon home listings, February 2022–March 2024, with monthly counts and March comparisons.

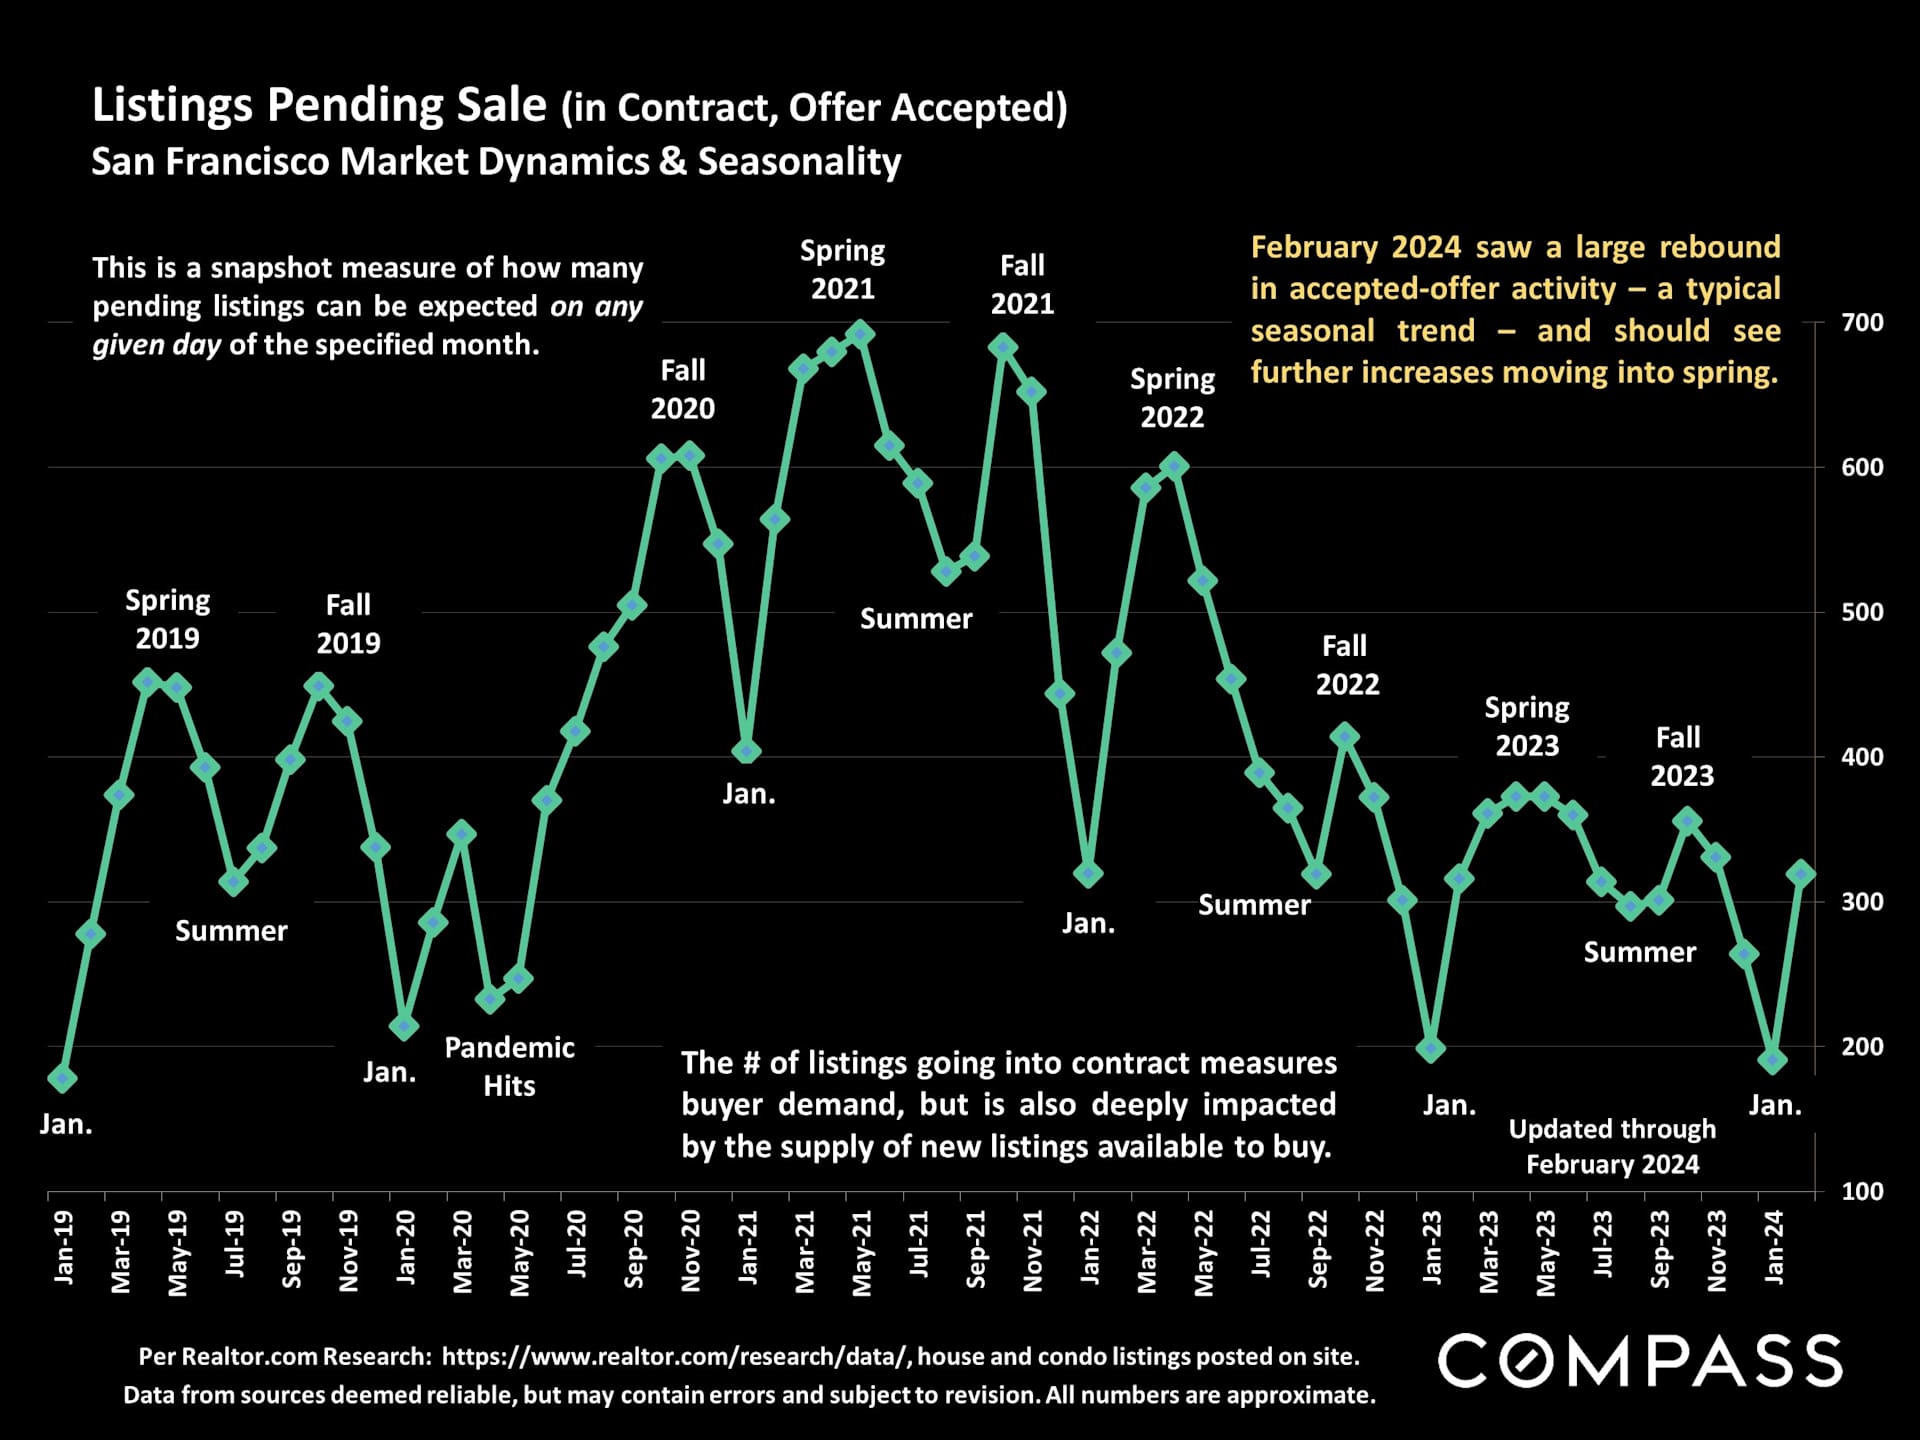
Chart of San Francisco pending listings from 2019 to February 2024, with seasonal peaks and a February 2024 rebound.

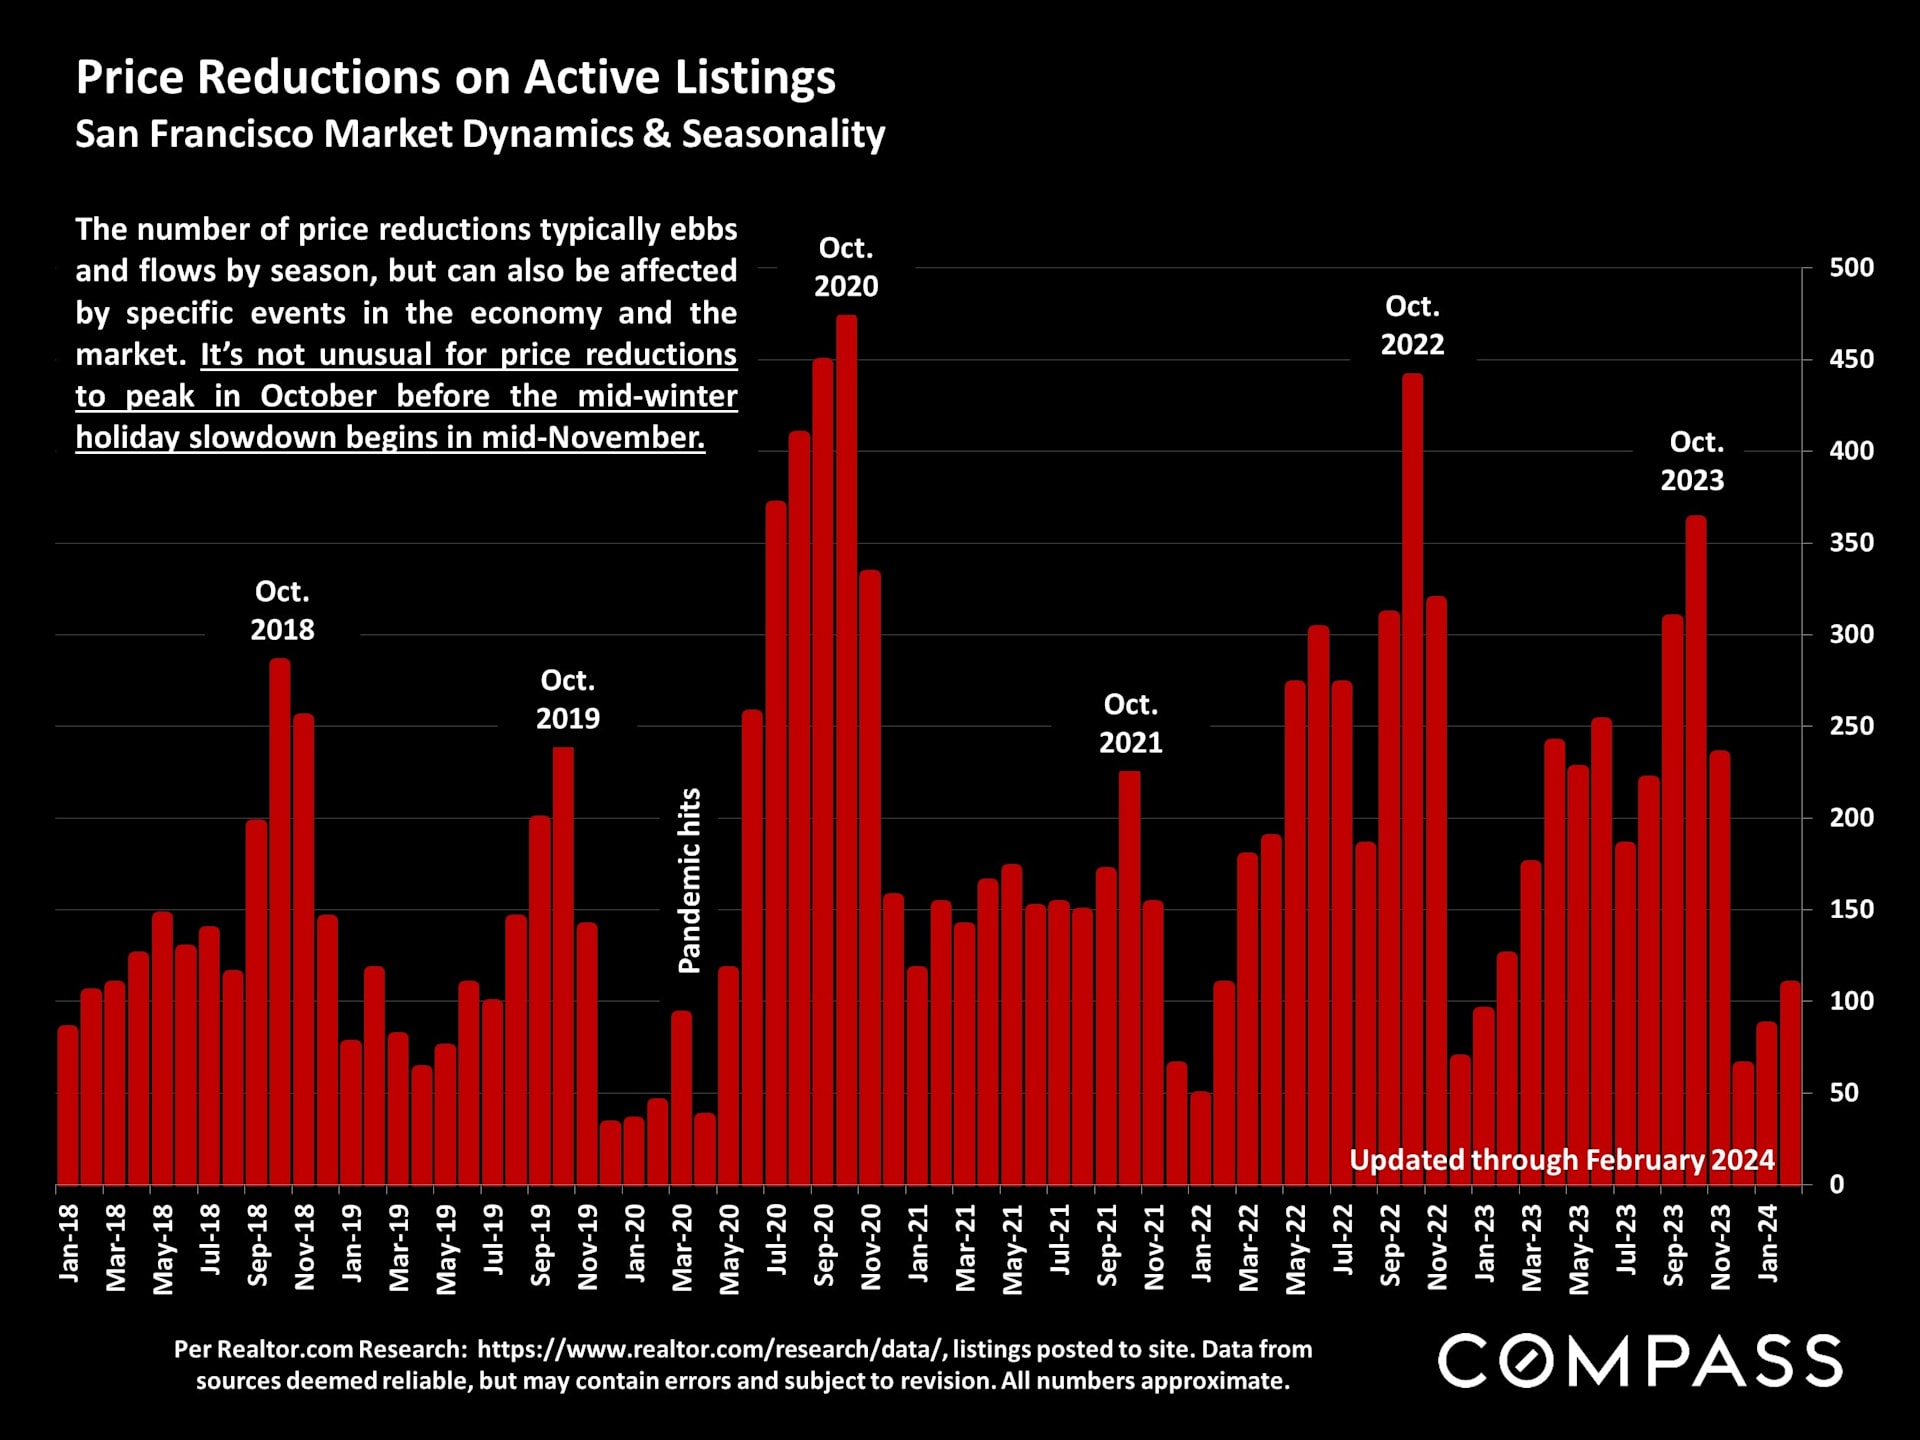
Chart of San Francisco active-listing price reductions, with monthly red bars and labeled October peaks from 2018 to 2023.

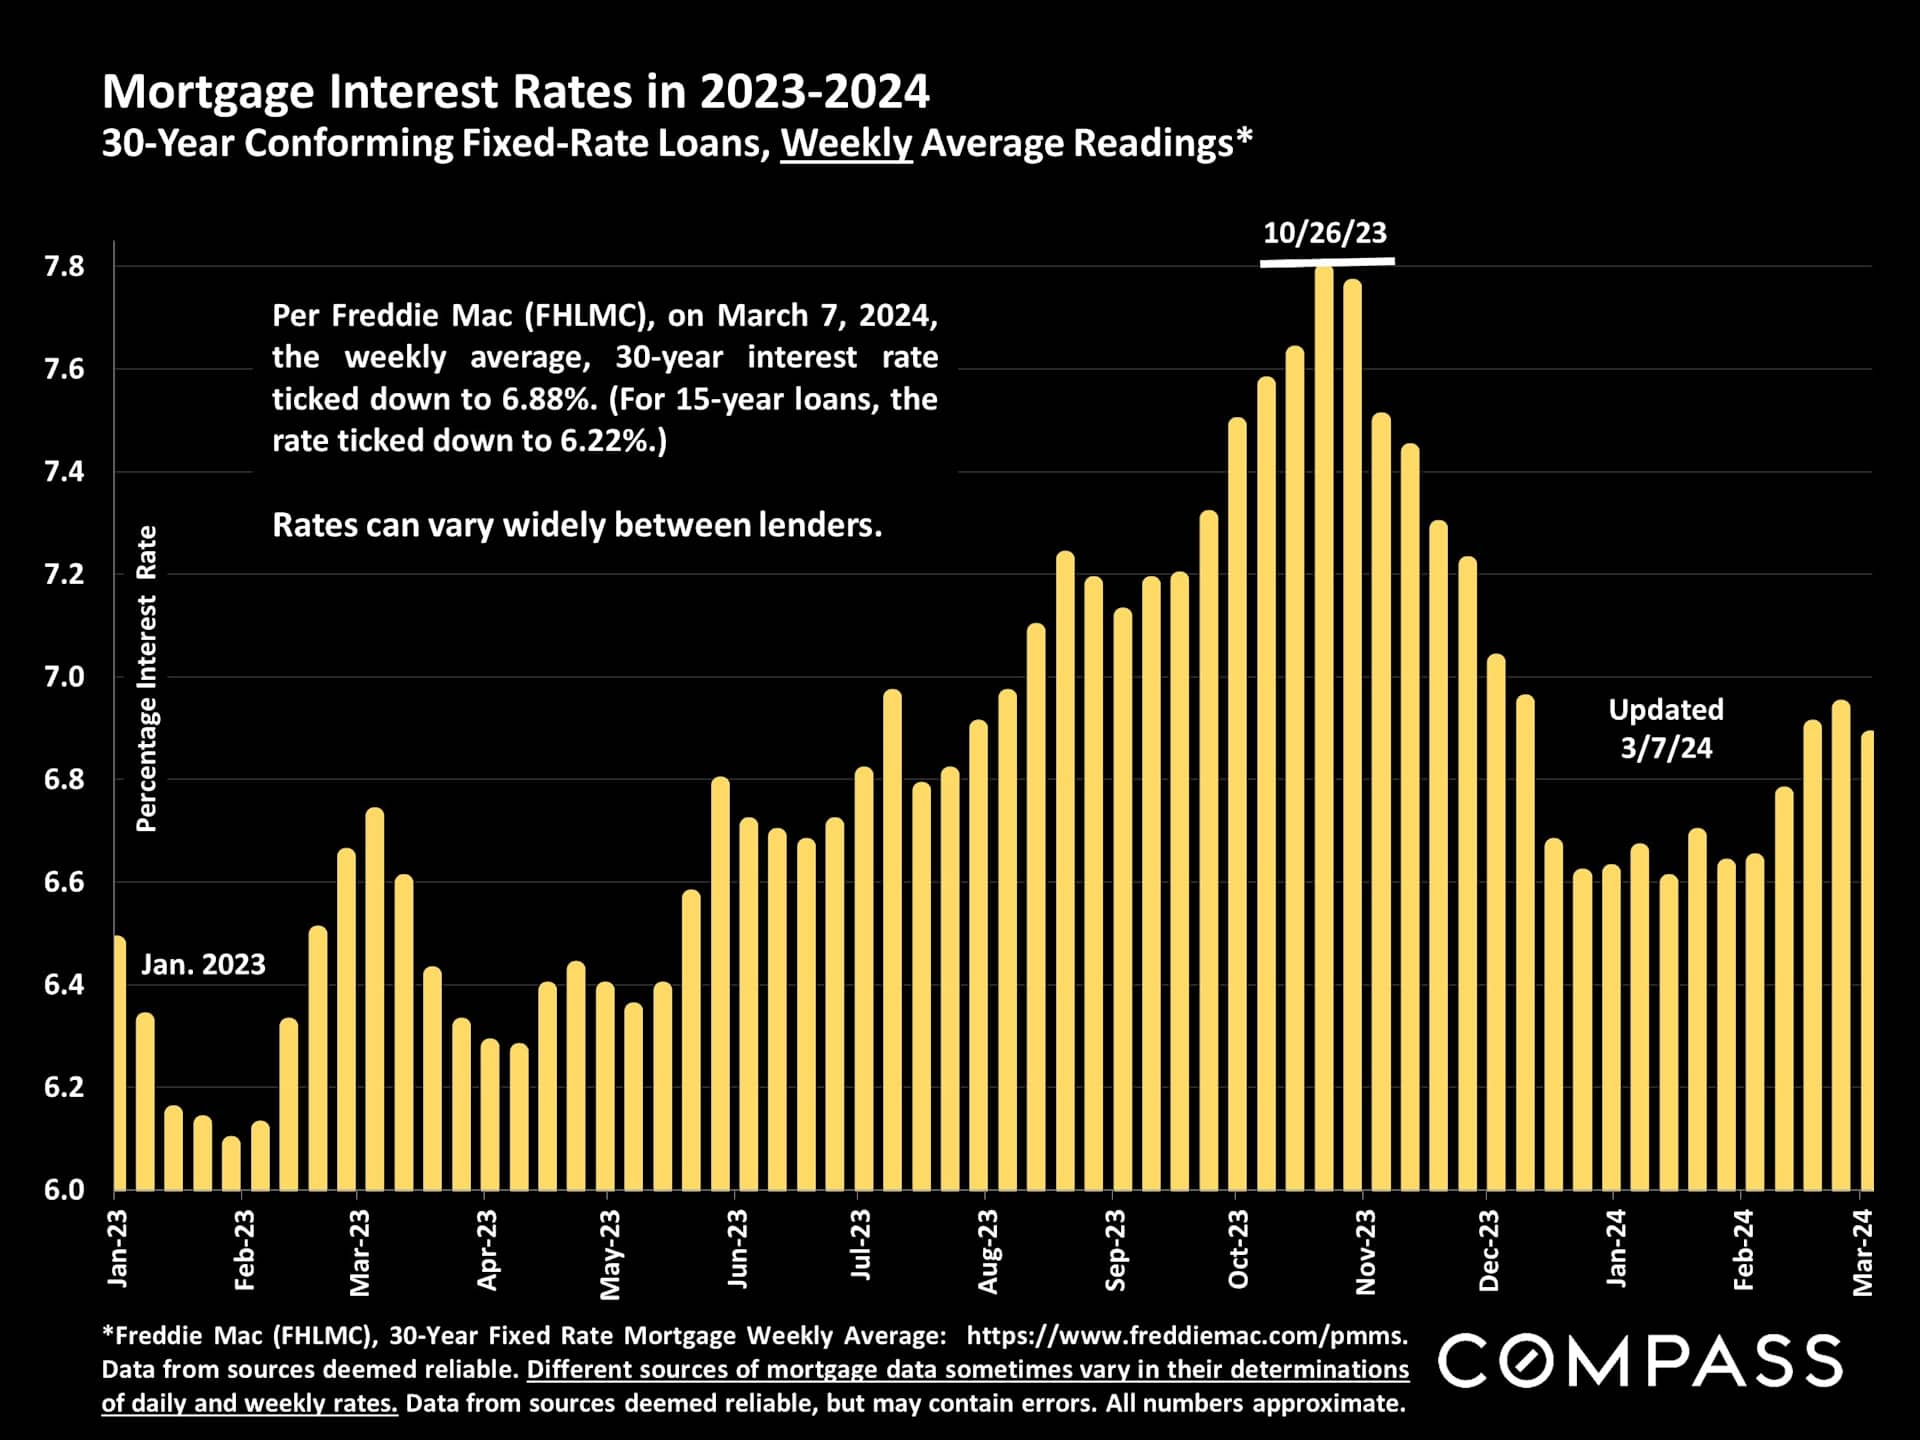
Chart of 2023–2024 mortgage rates, peaking near 7.8% in October 2023 and ending at 6.88% in March 2024.

Market report disclaimer explaining real estate statistics, valuation measures, data sources, and Compass legal terms.

Work With Us

Cece Doricko San Francisco Real Estate specializes in luxury properties and has developed an incredible network to help you find the home of your dreams. Our well honed team of experts, preferred vendors, and Compass support will help prepare your home for the market with great efficiency to achieve the greatest value.