Cece's April 2024 Market Update

Cece's April 2024 Market Update

Market Conditions

Ever since the beginning of the year, and now moving into the spring selling season, striking shifts in supply and demand have occurred and continued to accelerate, resulting in a dramatic leap in the heat and competitiveness of market conditions. Based on current indicators illustrated in this report, and, more importantly, what is being experienced on the ground as new listings arrive on the market, deals are negotiated, and homes go into contract, it appears likely that significant home price increases will begin to show up in Q2 2024. 

Macroeconomic Conditions

In the 8 weeks through early April, the weekly average, 30-year conforming-loan interest rate has oscillated between 6.74% and 6.94%:  Up from January, but still well down from last fall. In the last month, the S&P 500 & Nasdaq stock market indices continued to hit new all-time highs, with substantial effects on household wealth. After the big jump in December-January, consumer confidence is at its highest point in almost 3 years. Monthly inflation rates have remained stable since October, ranging from 3.1% to 3.3%: Higher than the Fed’s 2% goal, but reductions in its benchmark rate later this year are still commonly expected.
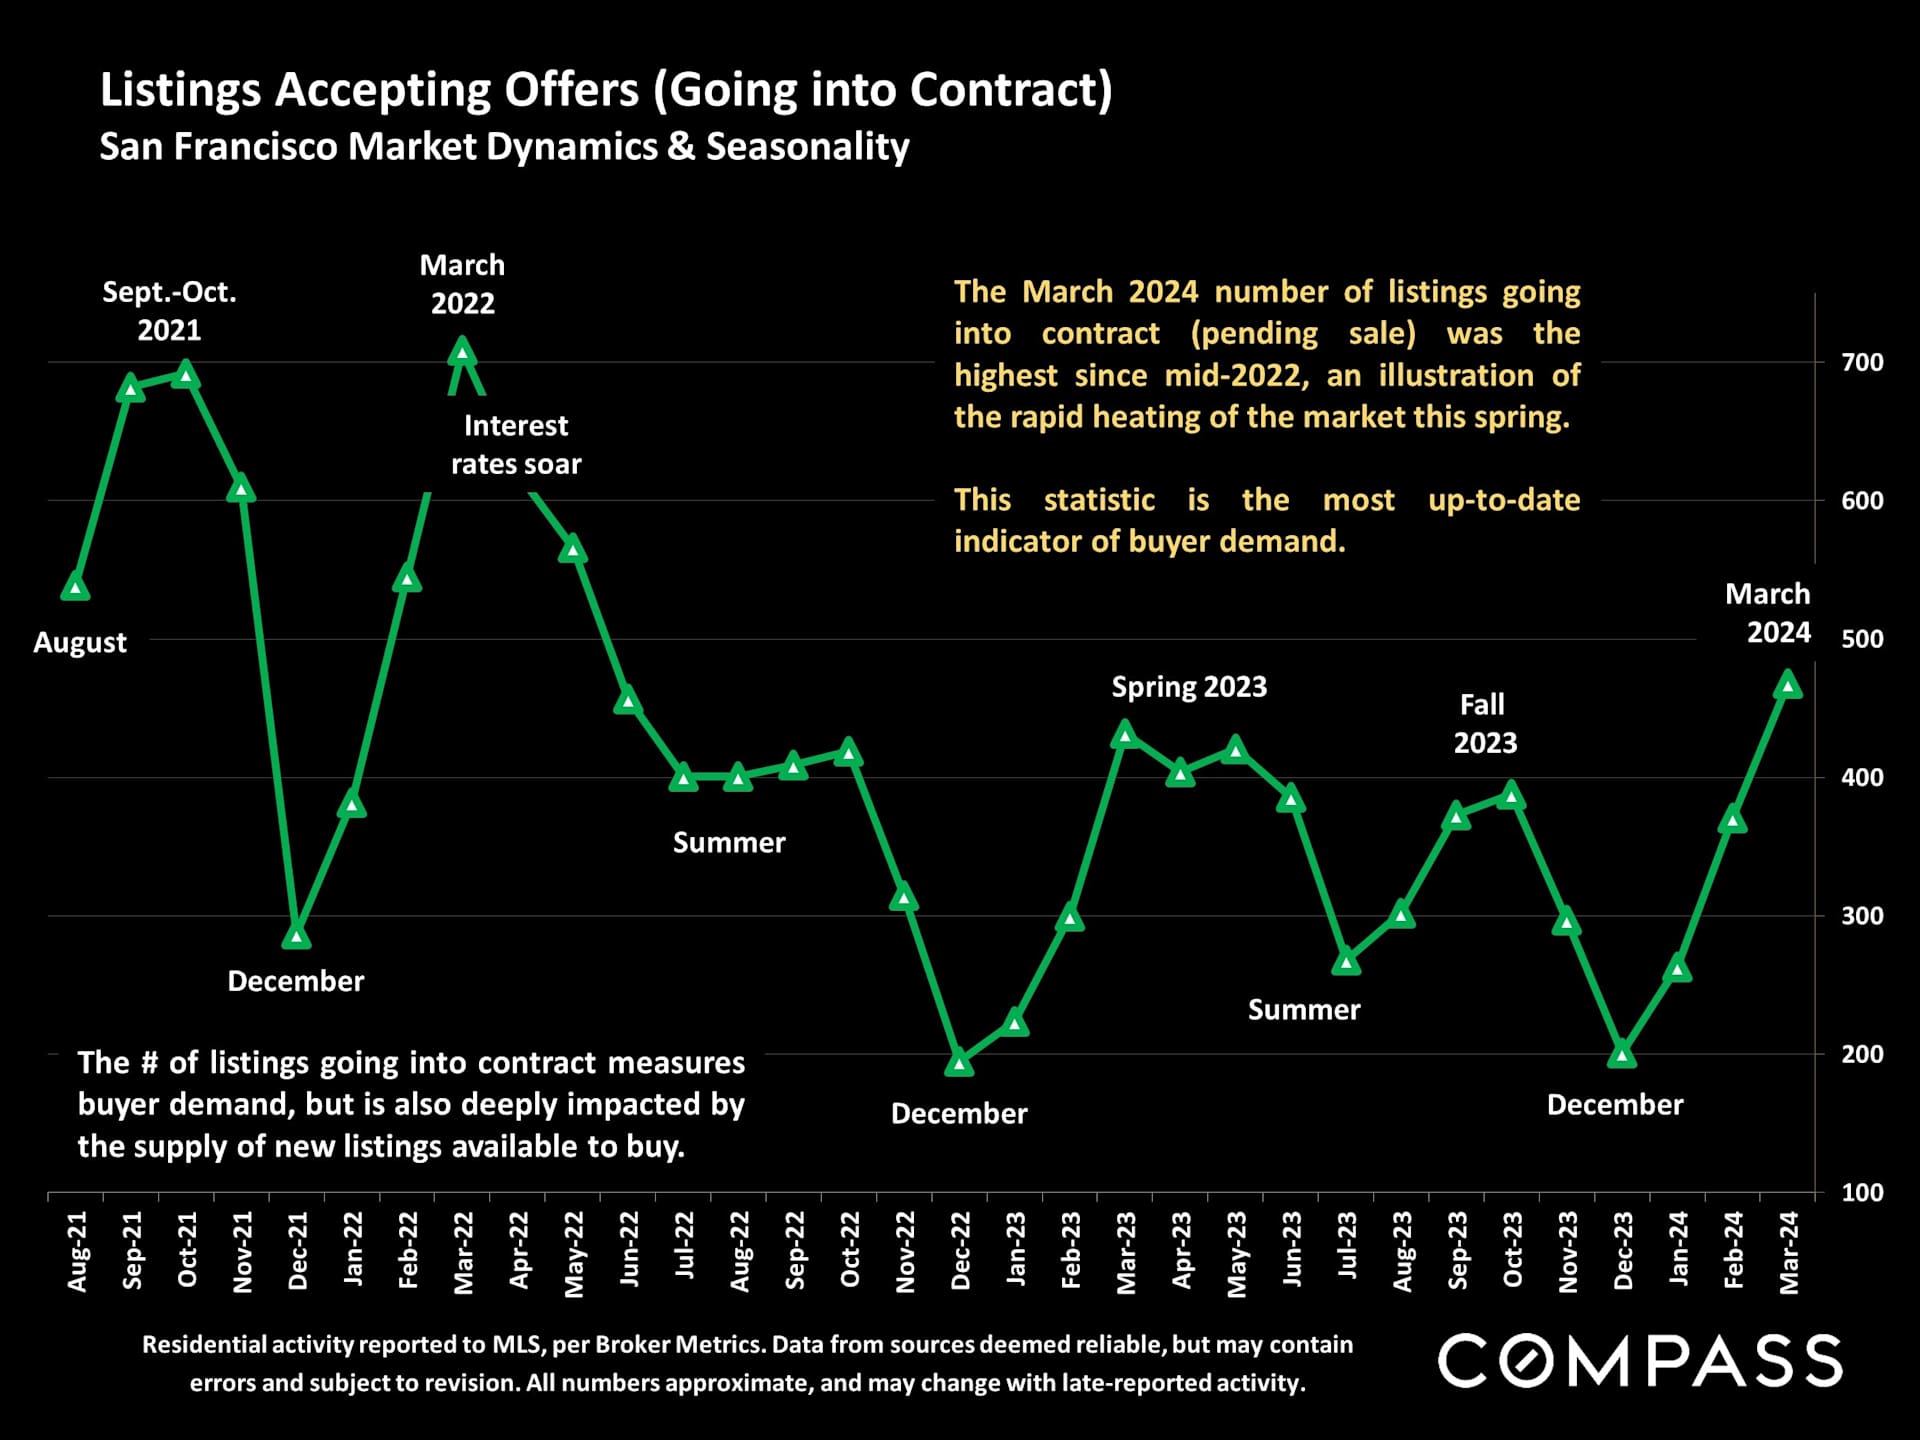
San Francisco listings-under-contract chart, with a green monthly trend line from August 2021 to March 2024.

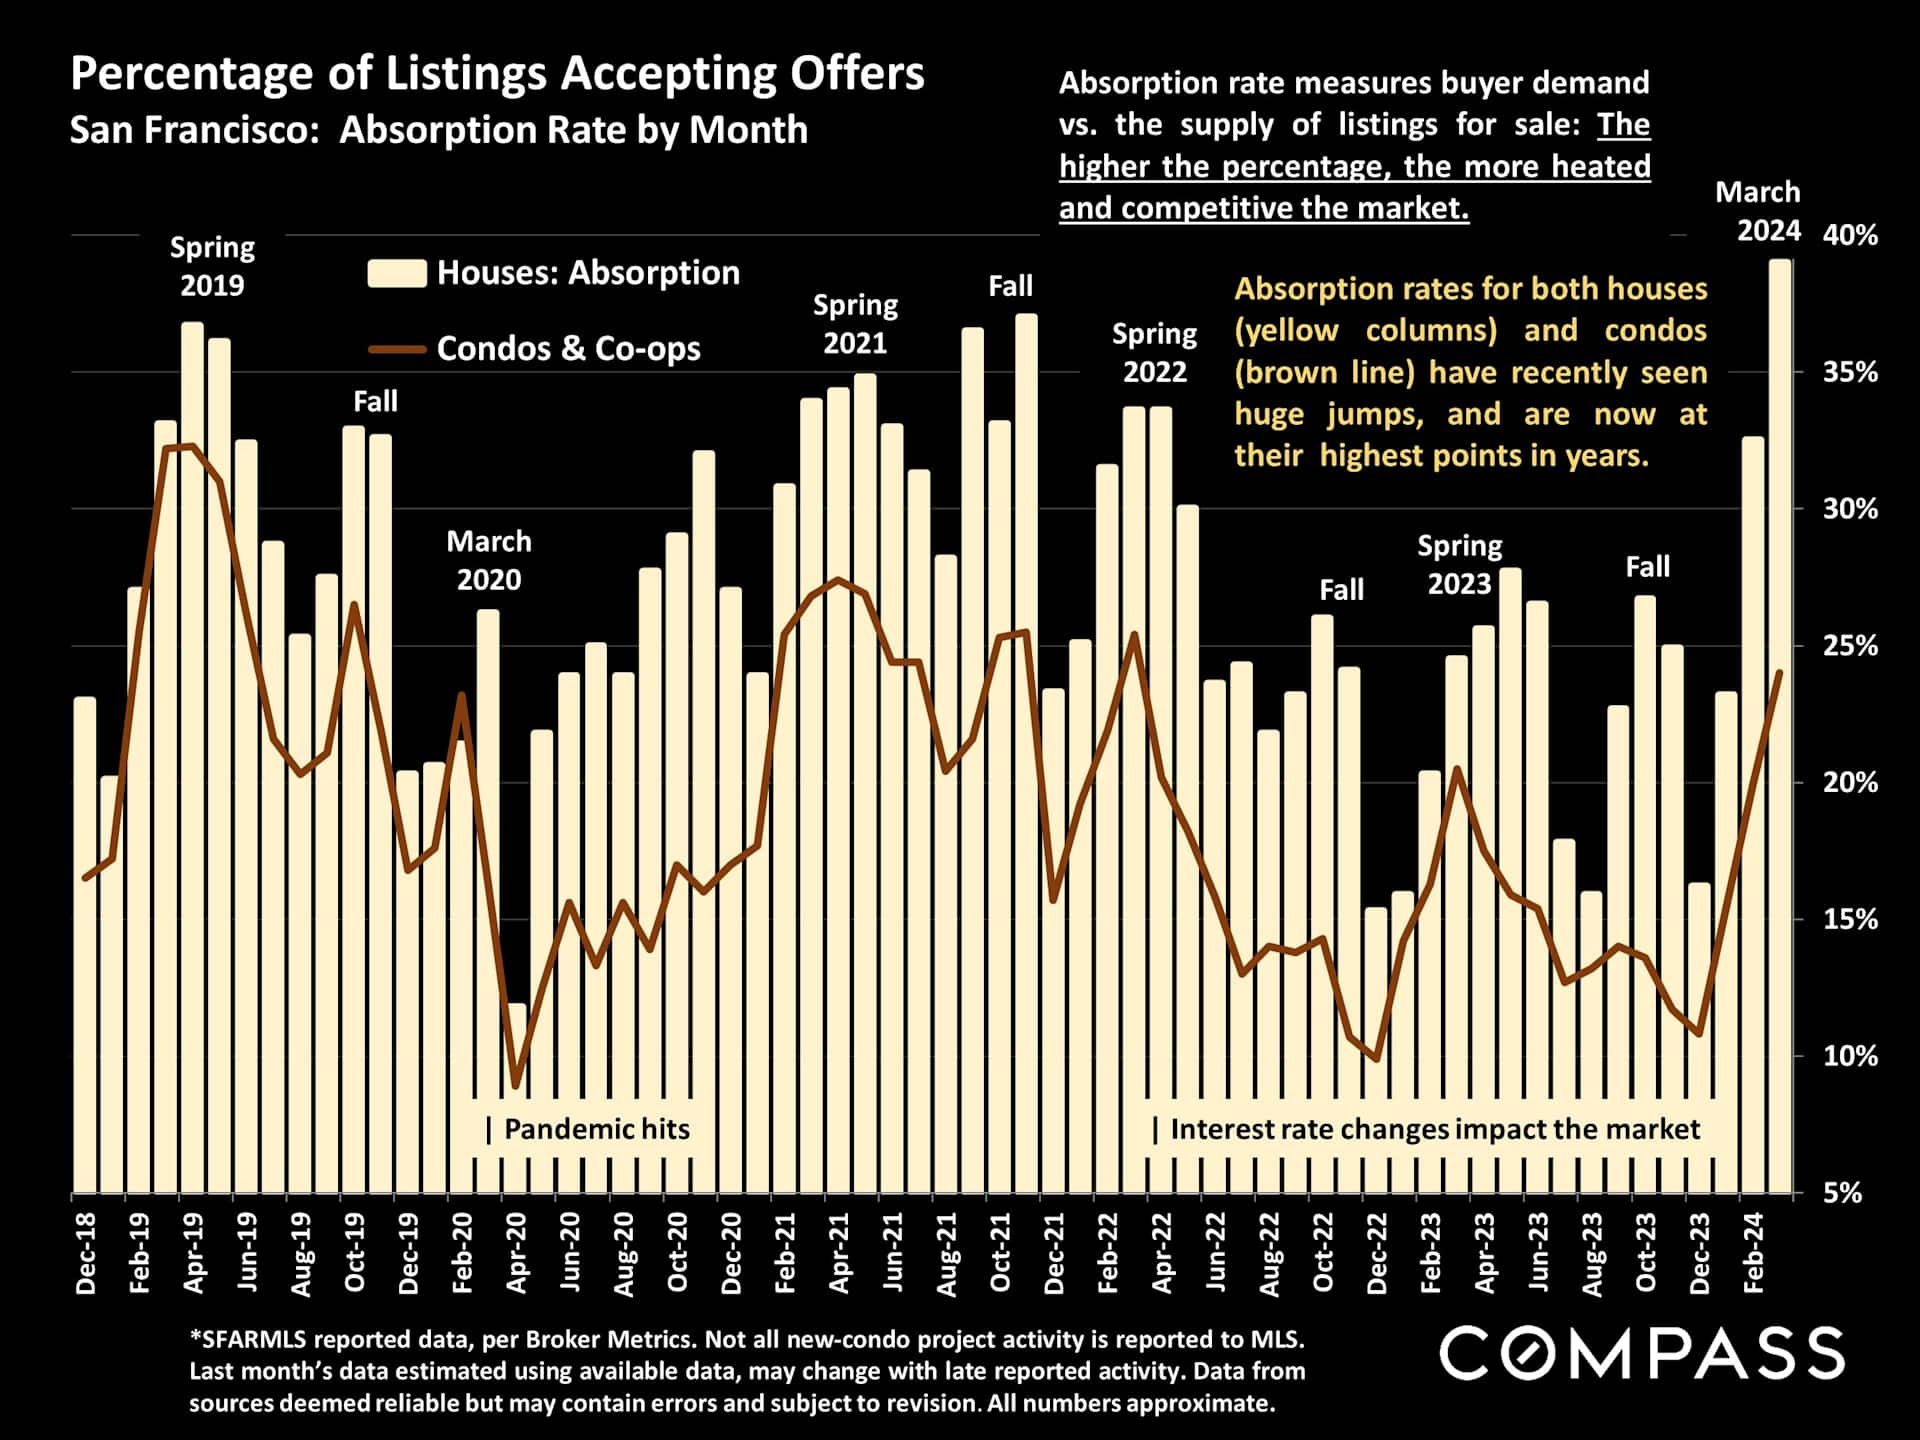
Chart of San Francisco home absorption rates, with monthly house columns and a condo line from 2018 to 2024.

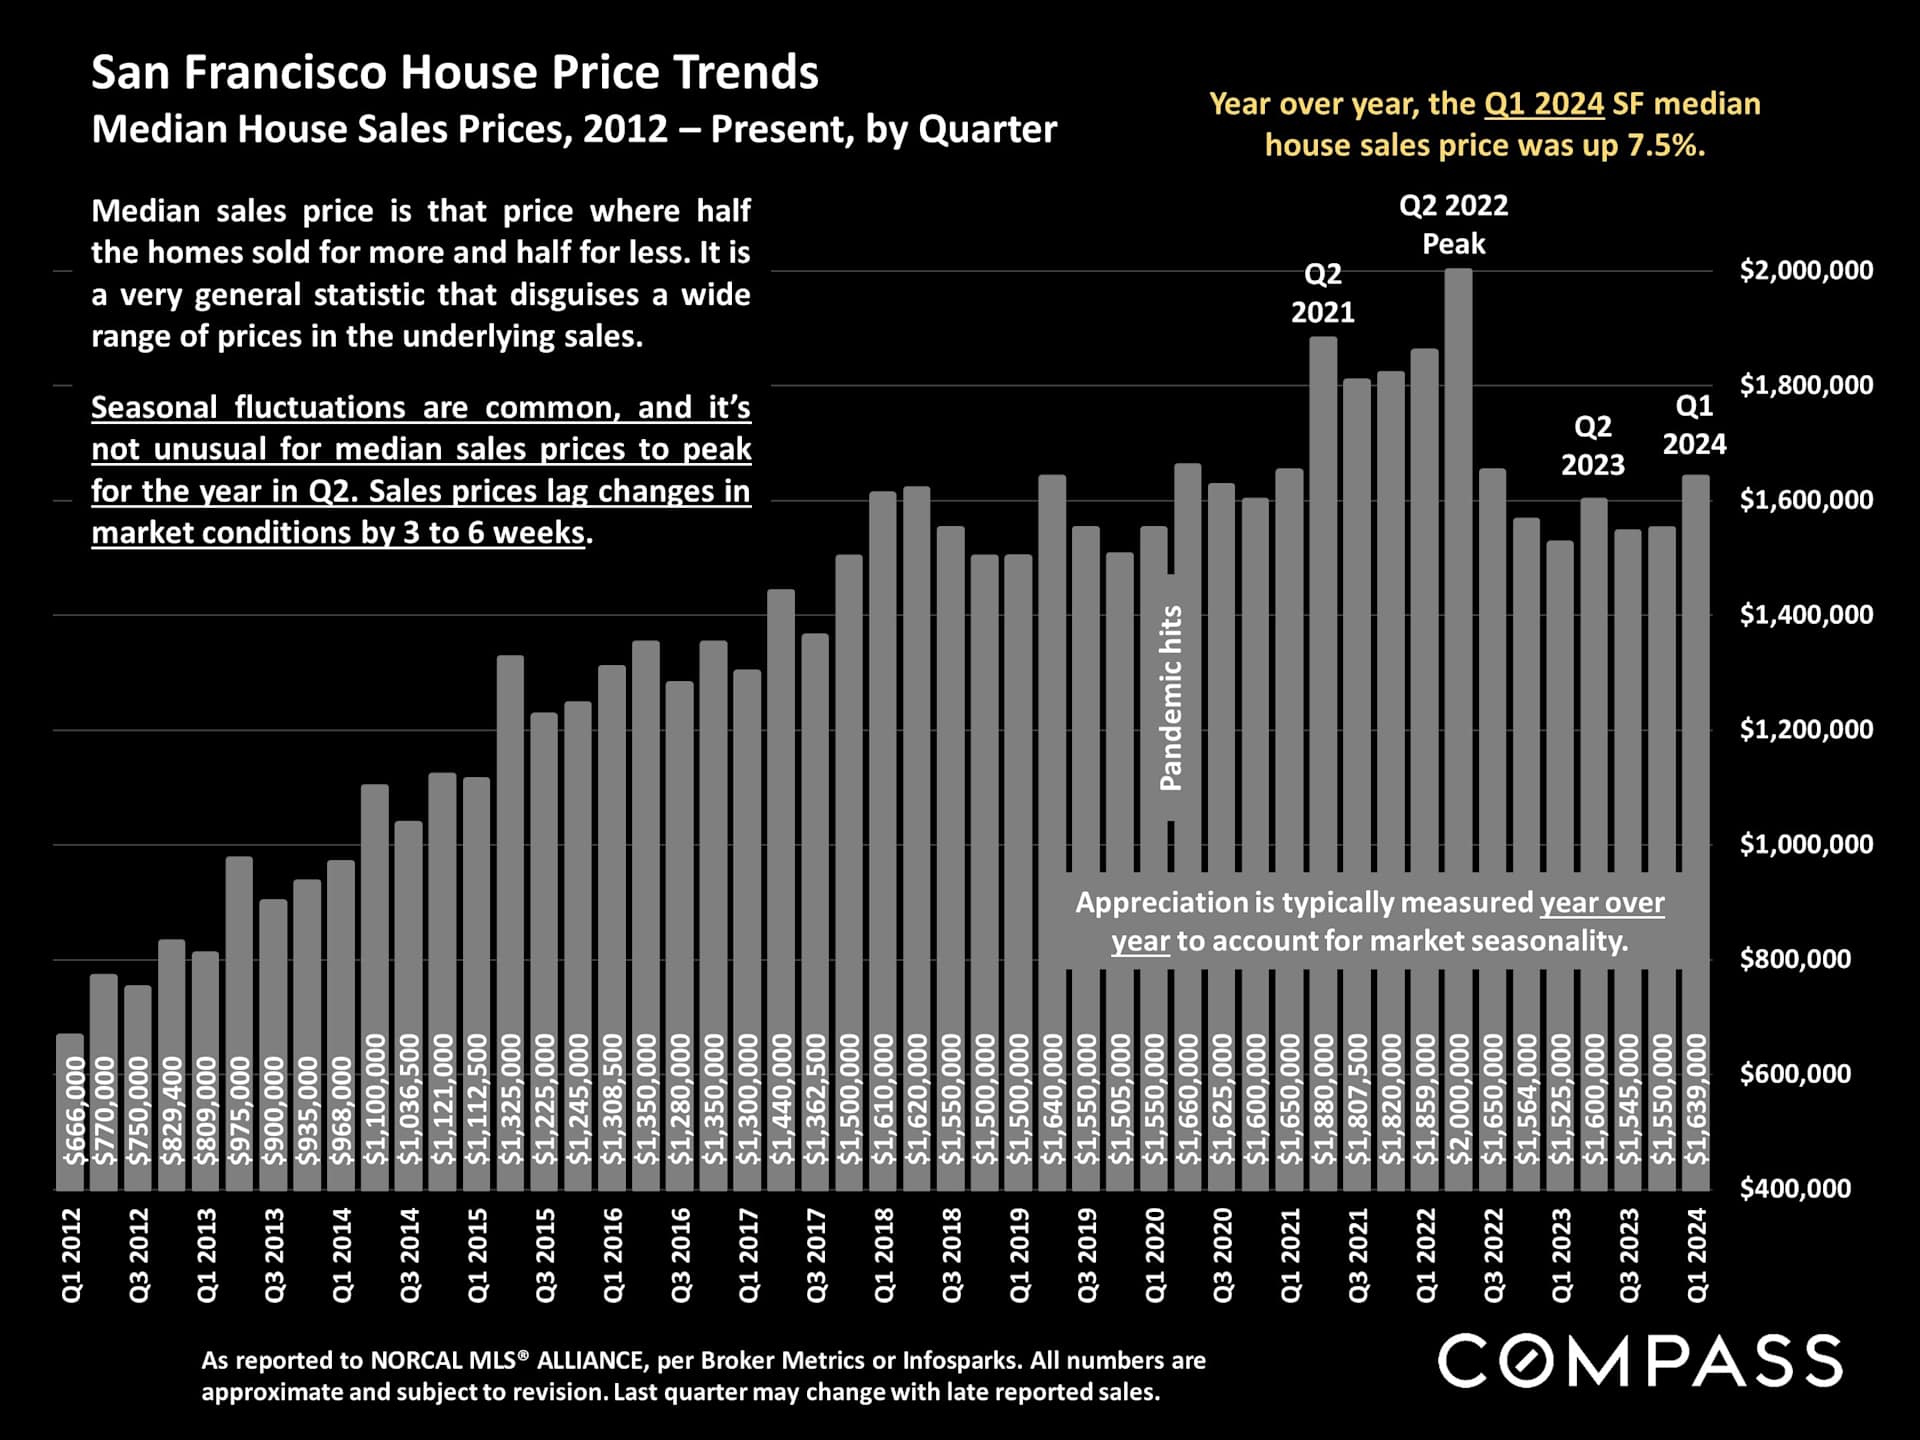
Chart of San Francisco median house prices by quarter, 2012–2024, with a 7.5% year-over-year rise in Q1 2024.

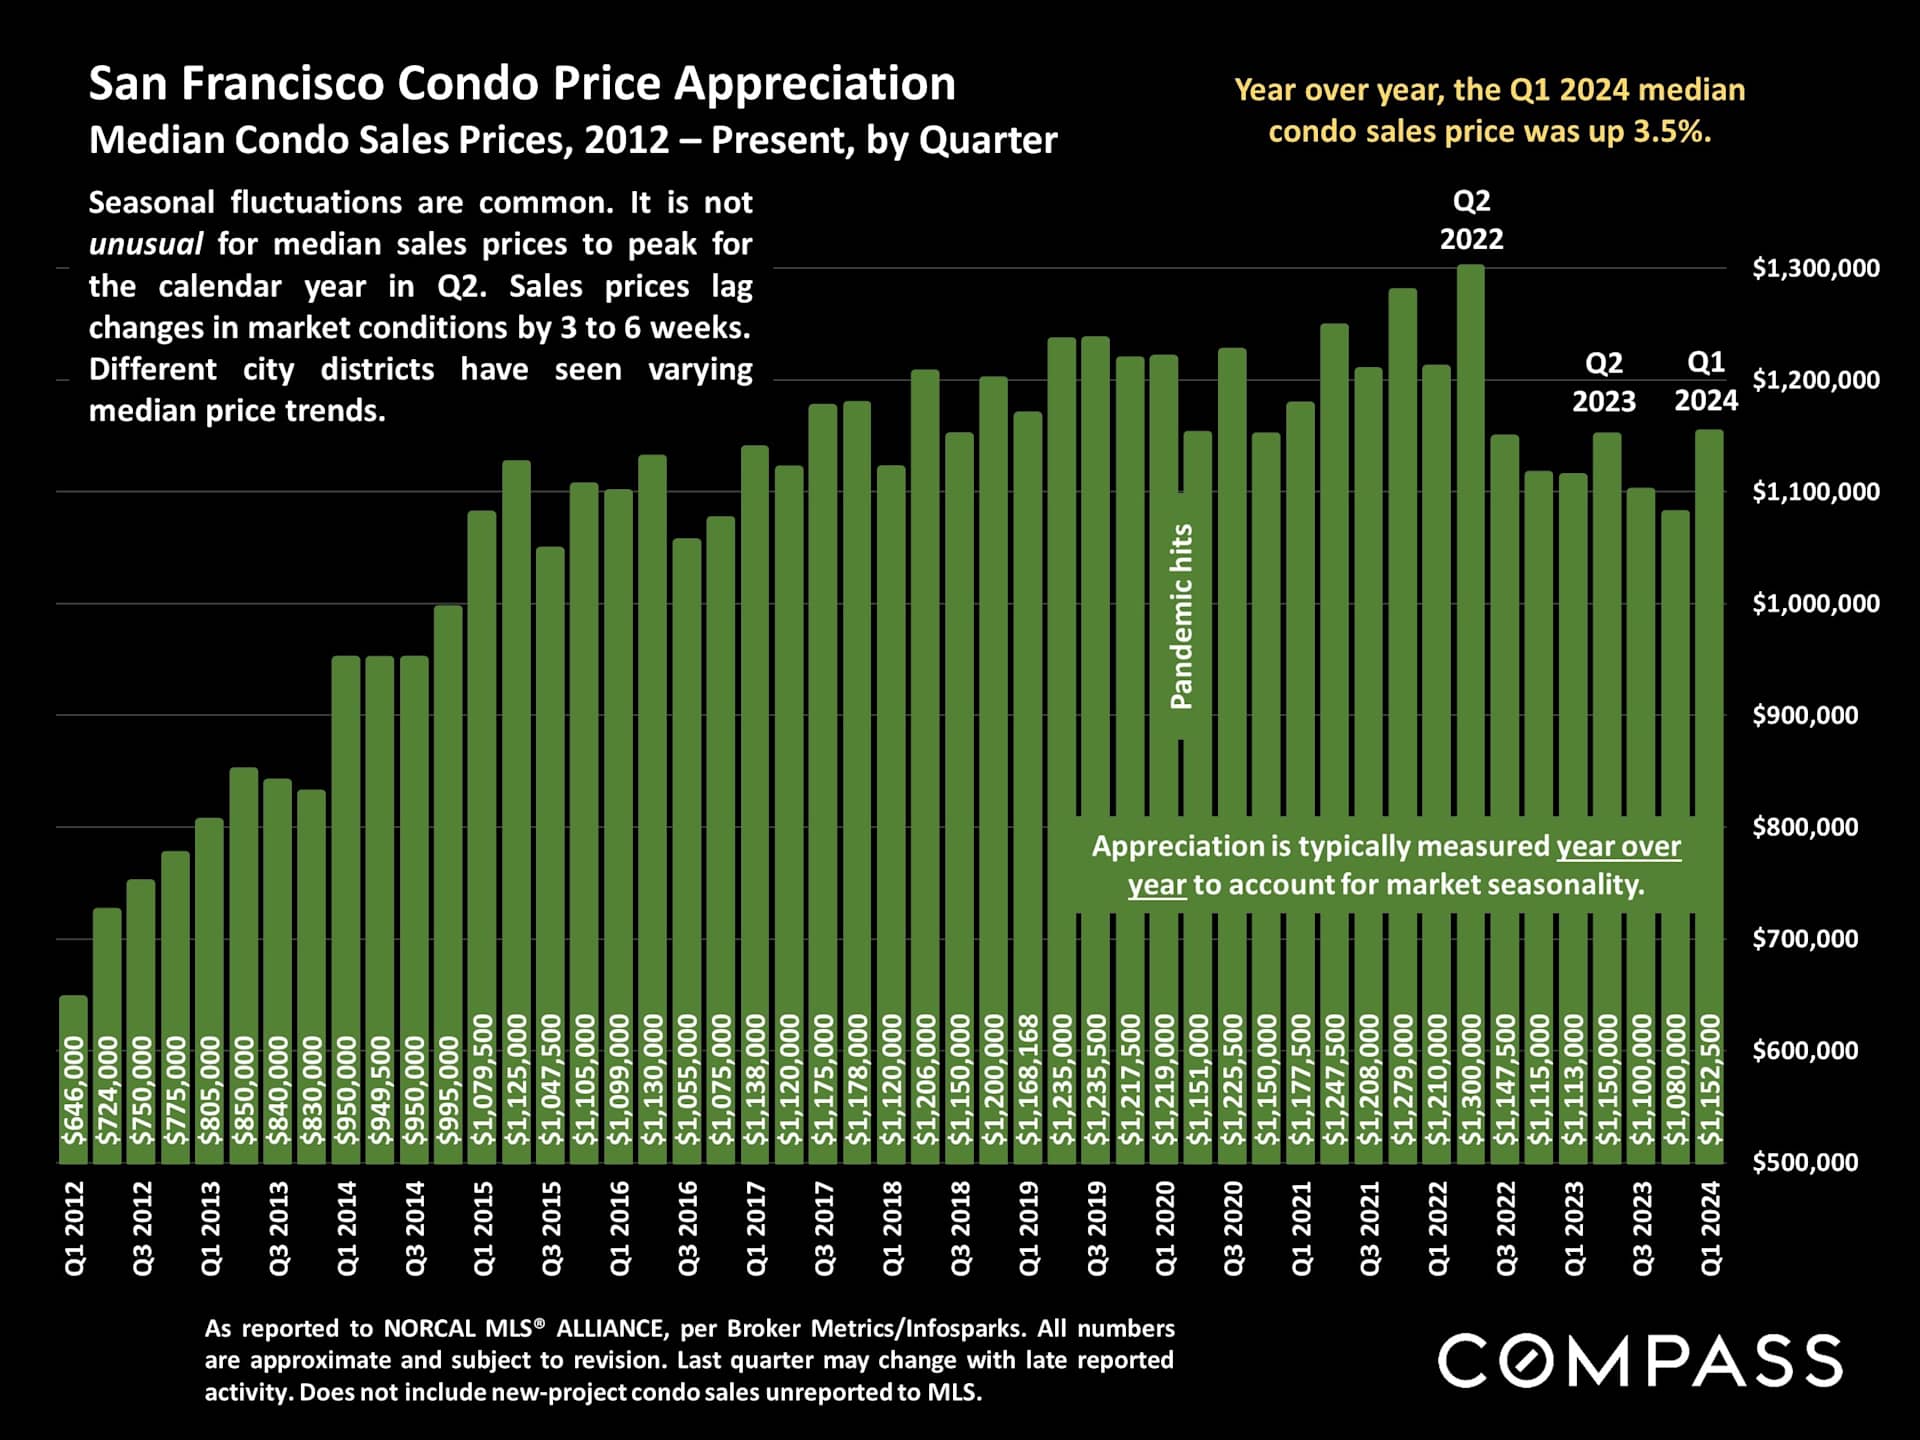
Chart of San Francisco condo prices by quarter, showing a 3.5% year-over-year increase in Q1 2024.

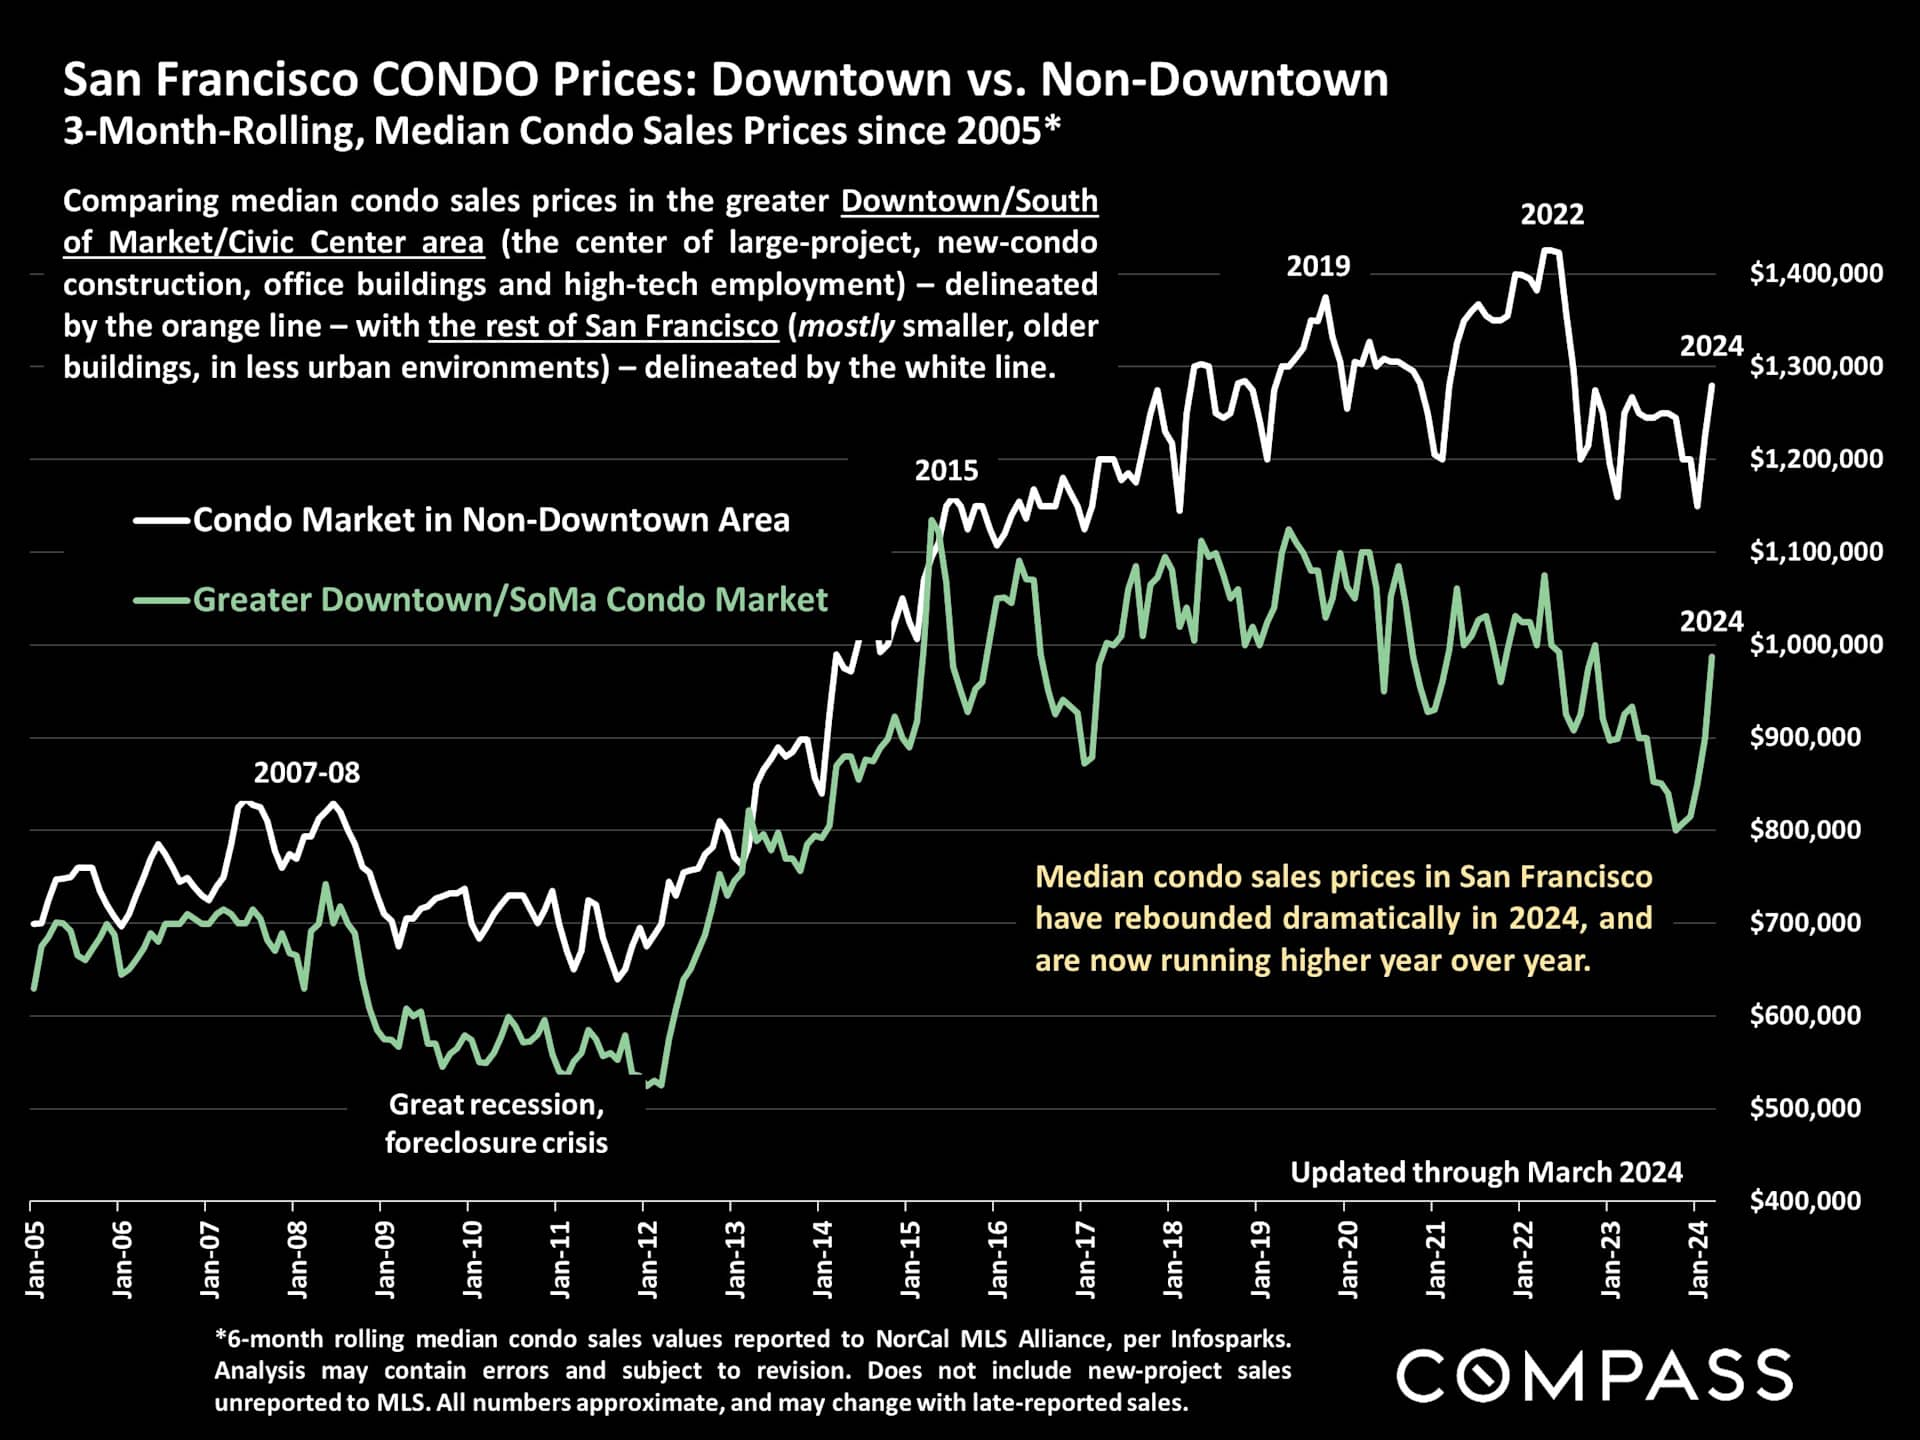
Chart comparing San Francisco downtown and non-downtown median condo prices from 2005 to March 2024.

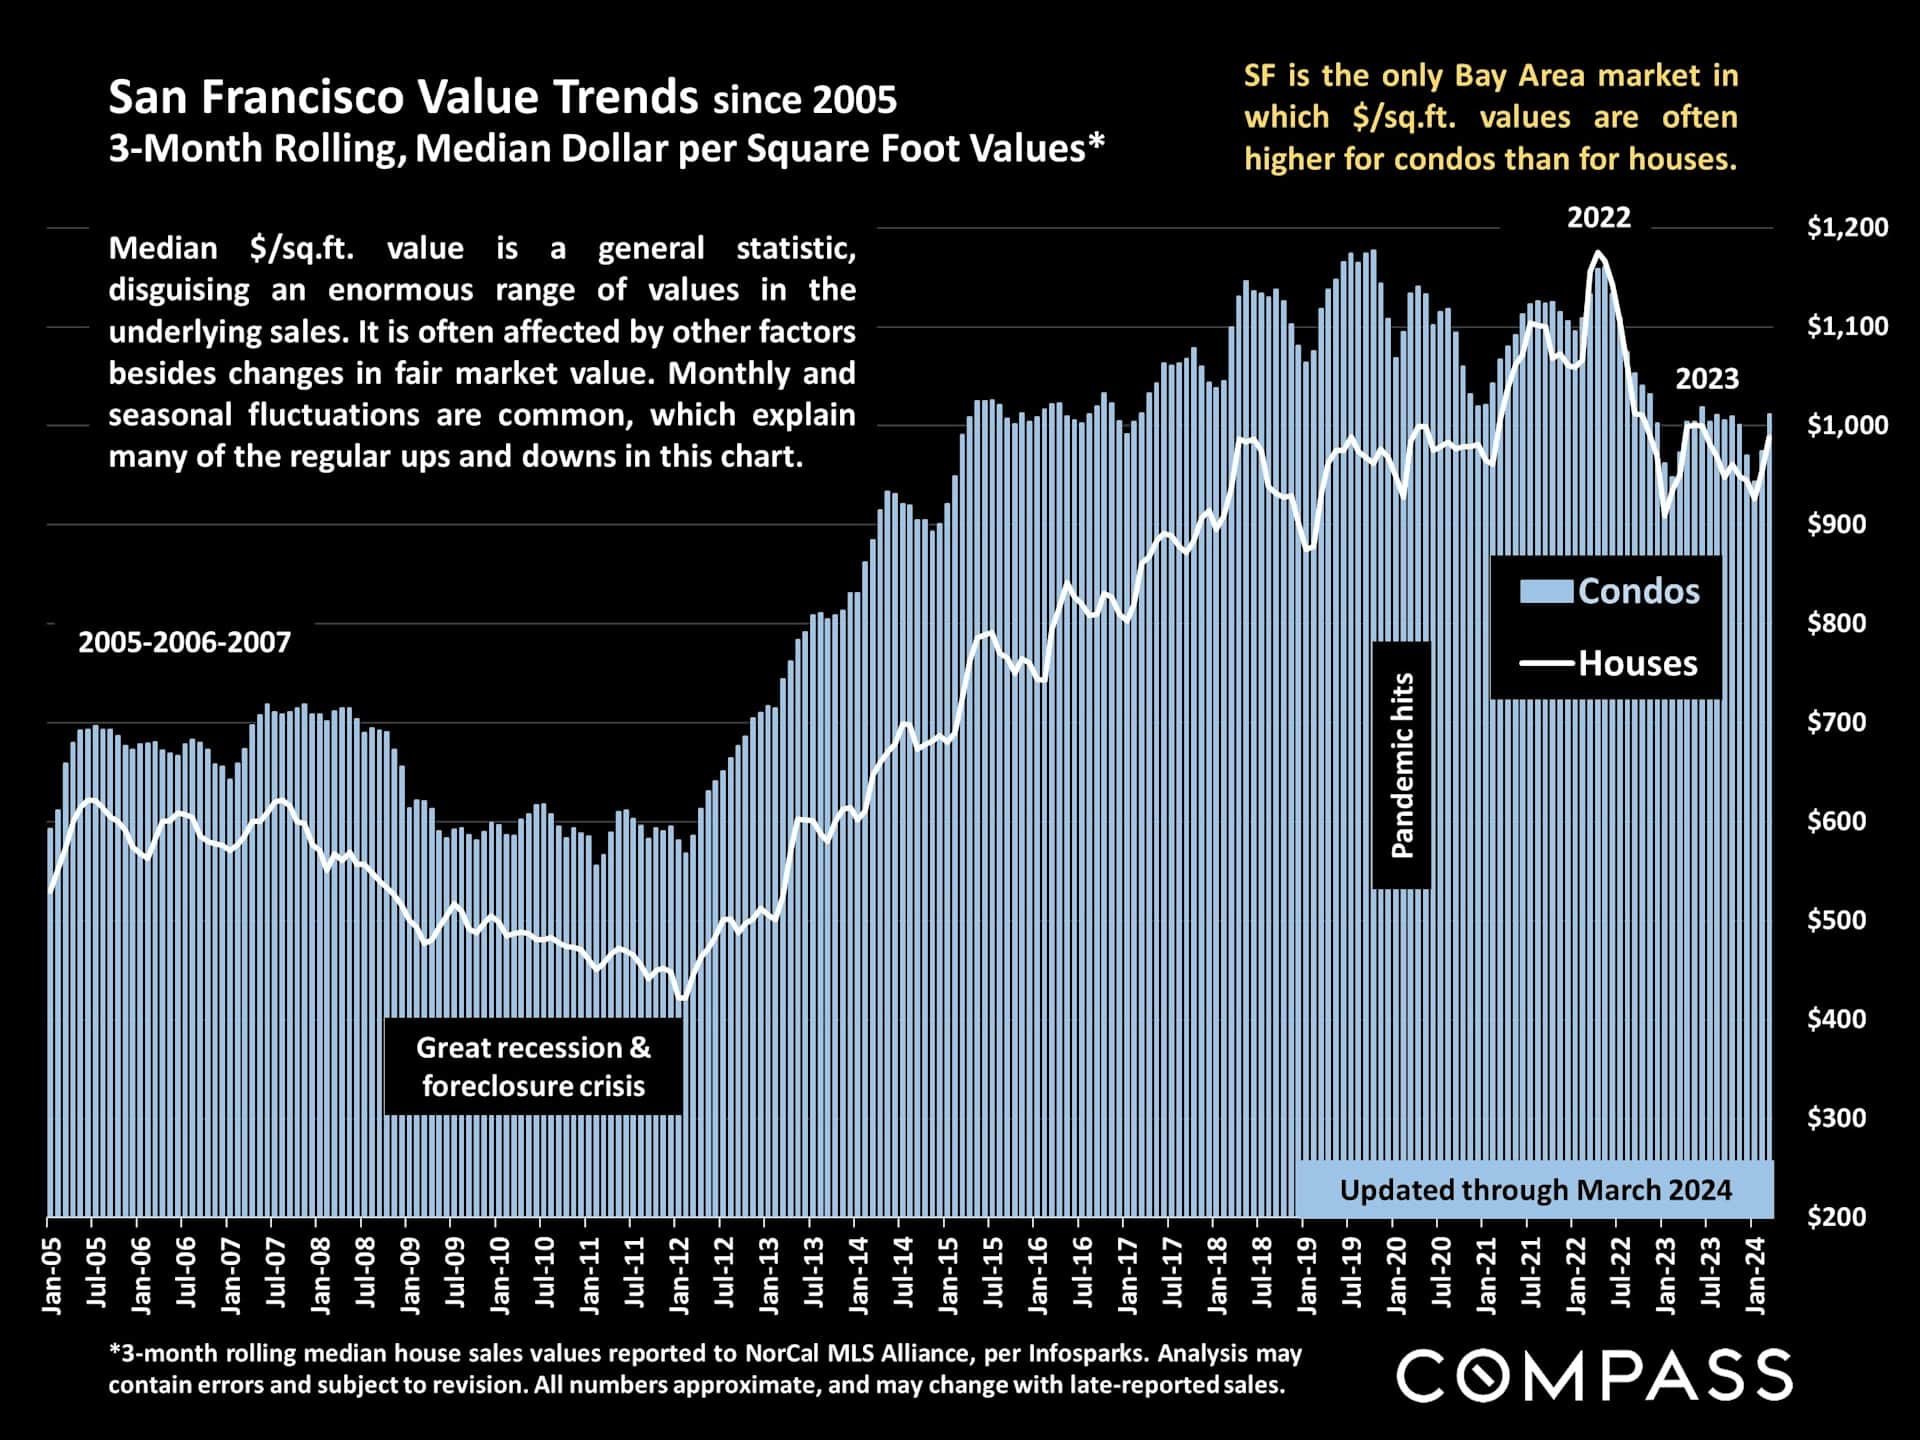
Chart comparing San Francisco condo and house prices per square foot from 2005 to 2024.

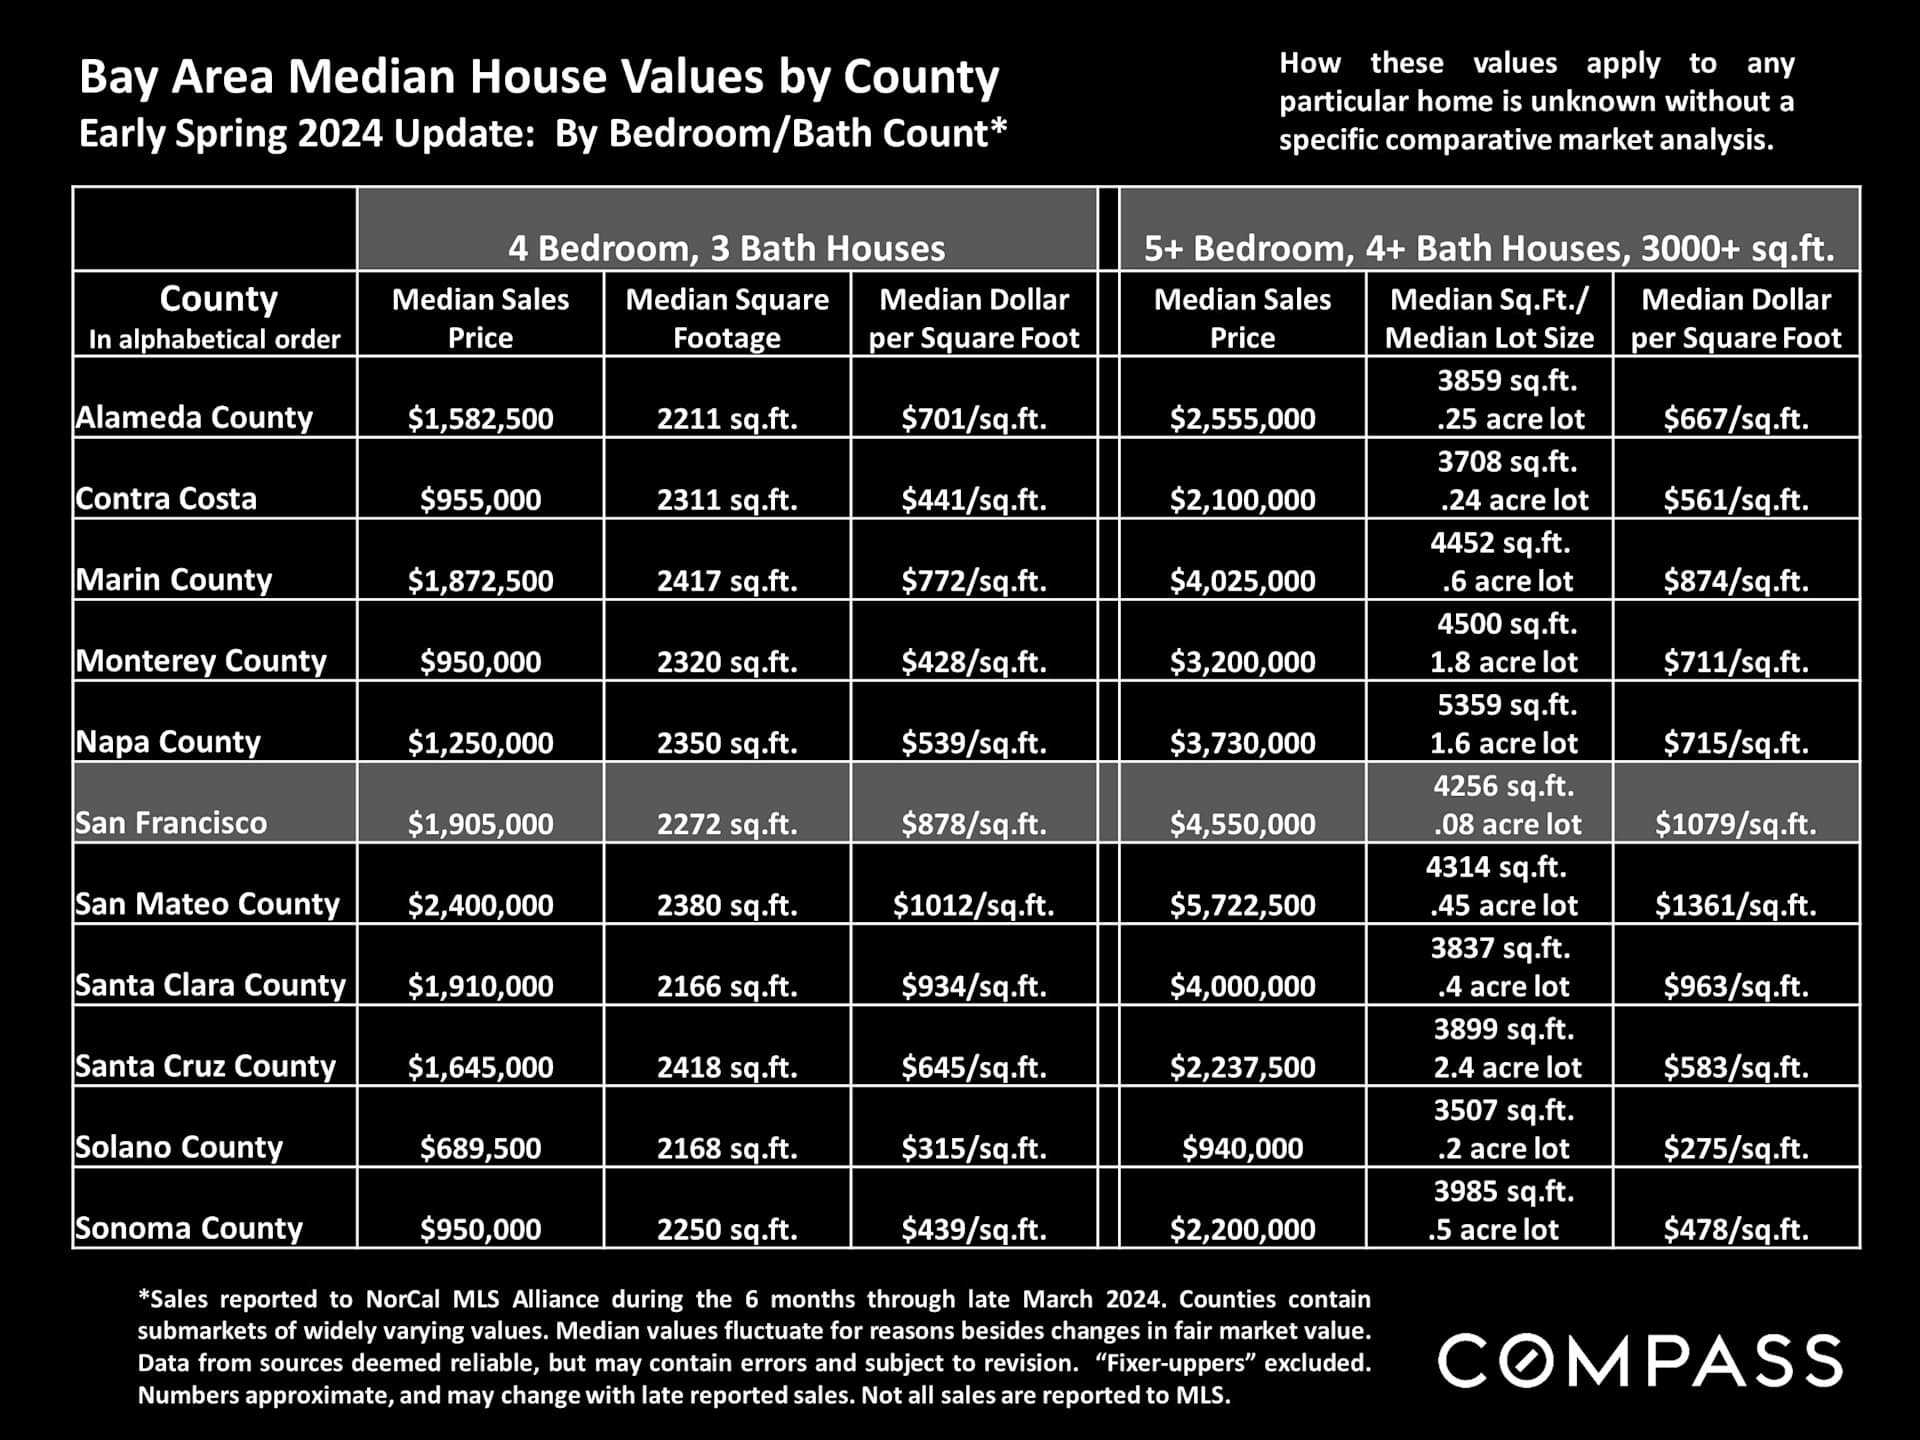
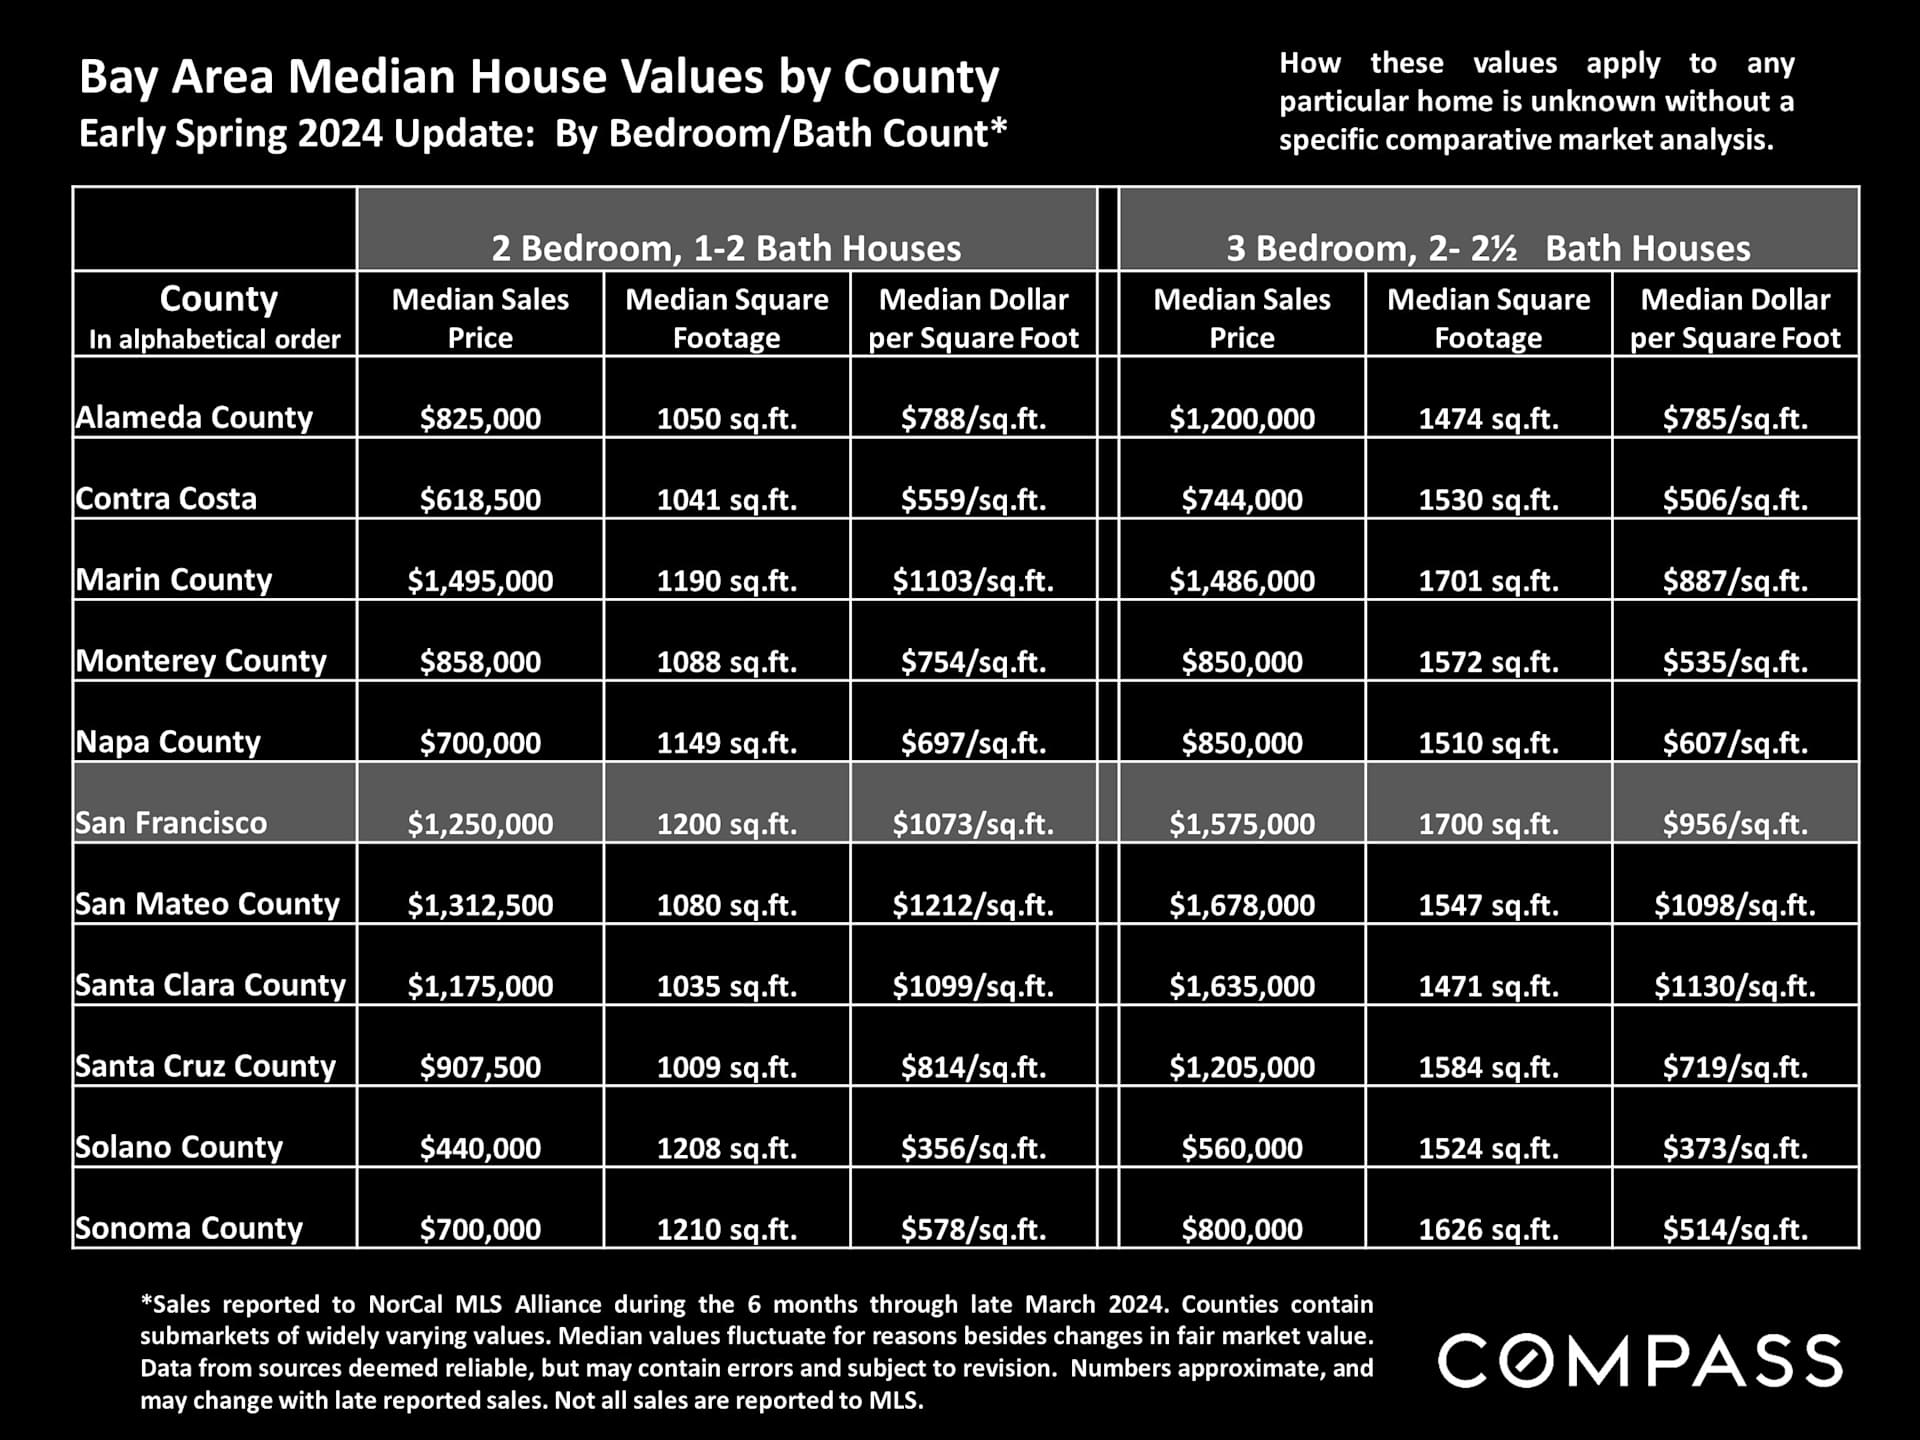
Bay Area county home value table comparing median prices and sizes by bedroom and bathroom count.

Table compares median home prices, square footage, and price per square foot across 11 counties by bedroom and bath count.

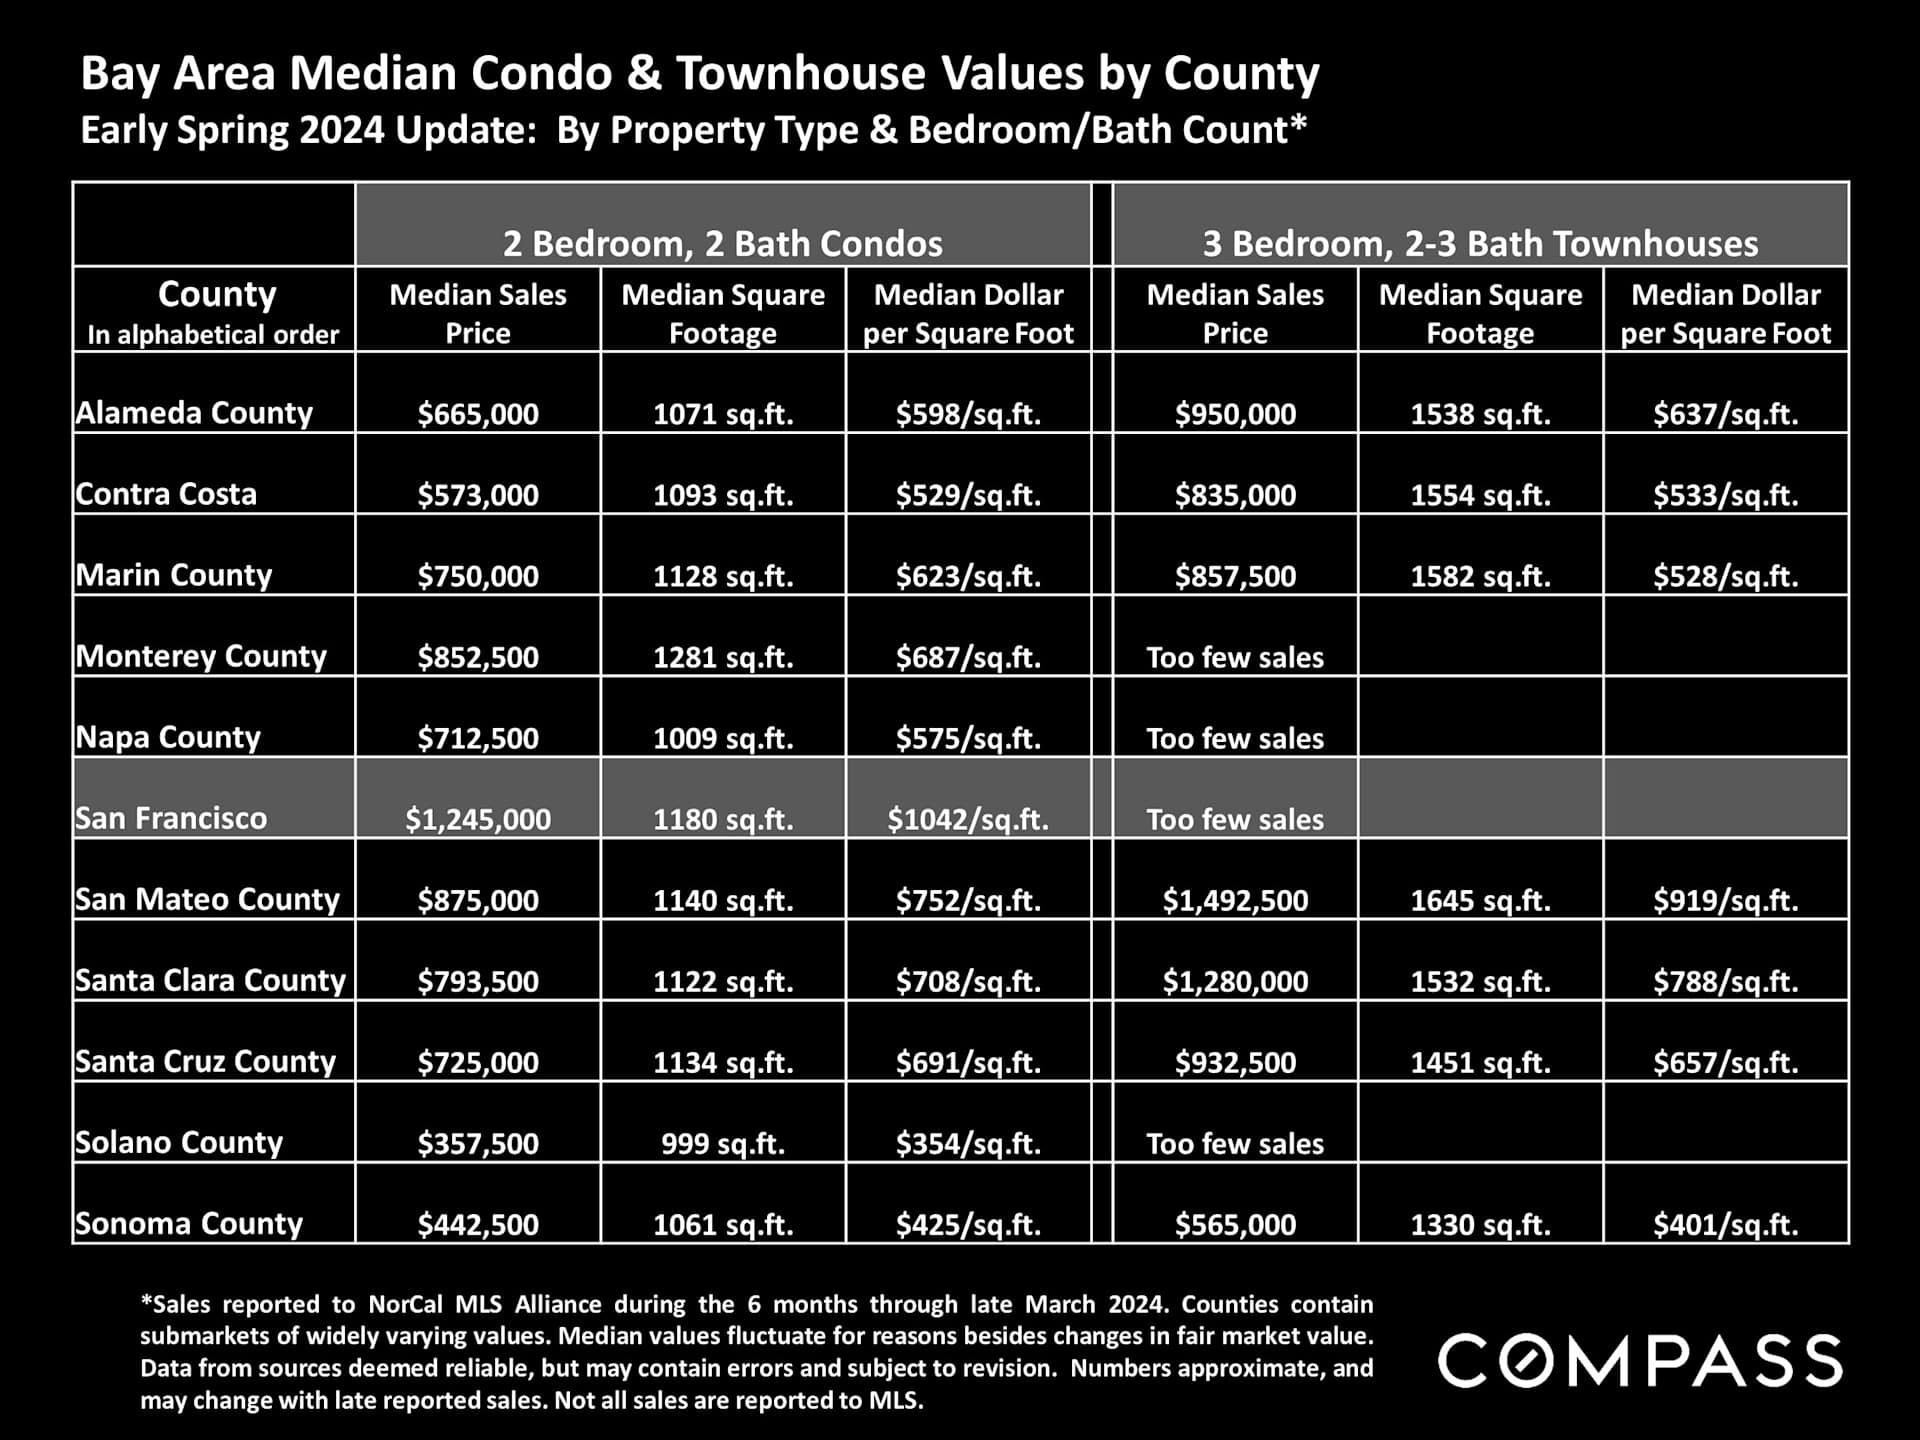
Bay Area condo and townhouse values by county in an early spring 2024 market chart.

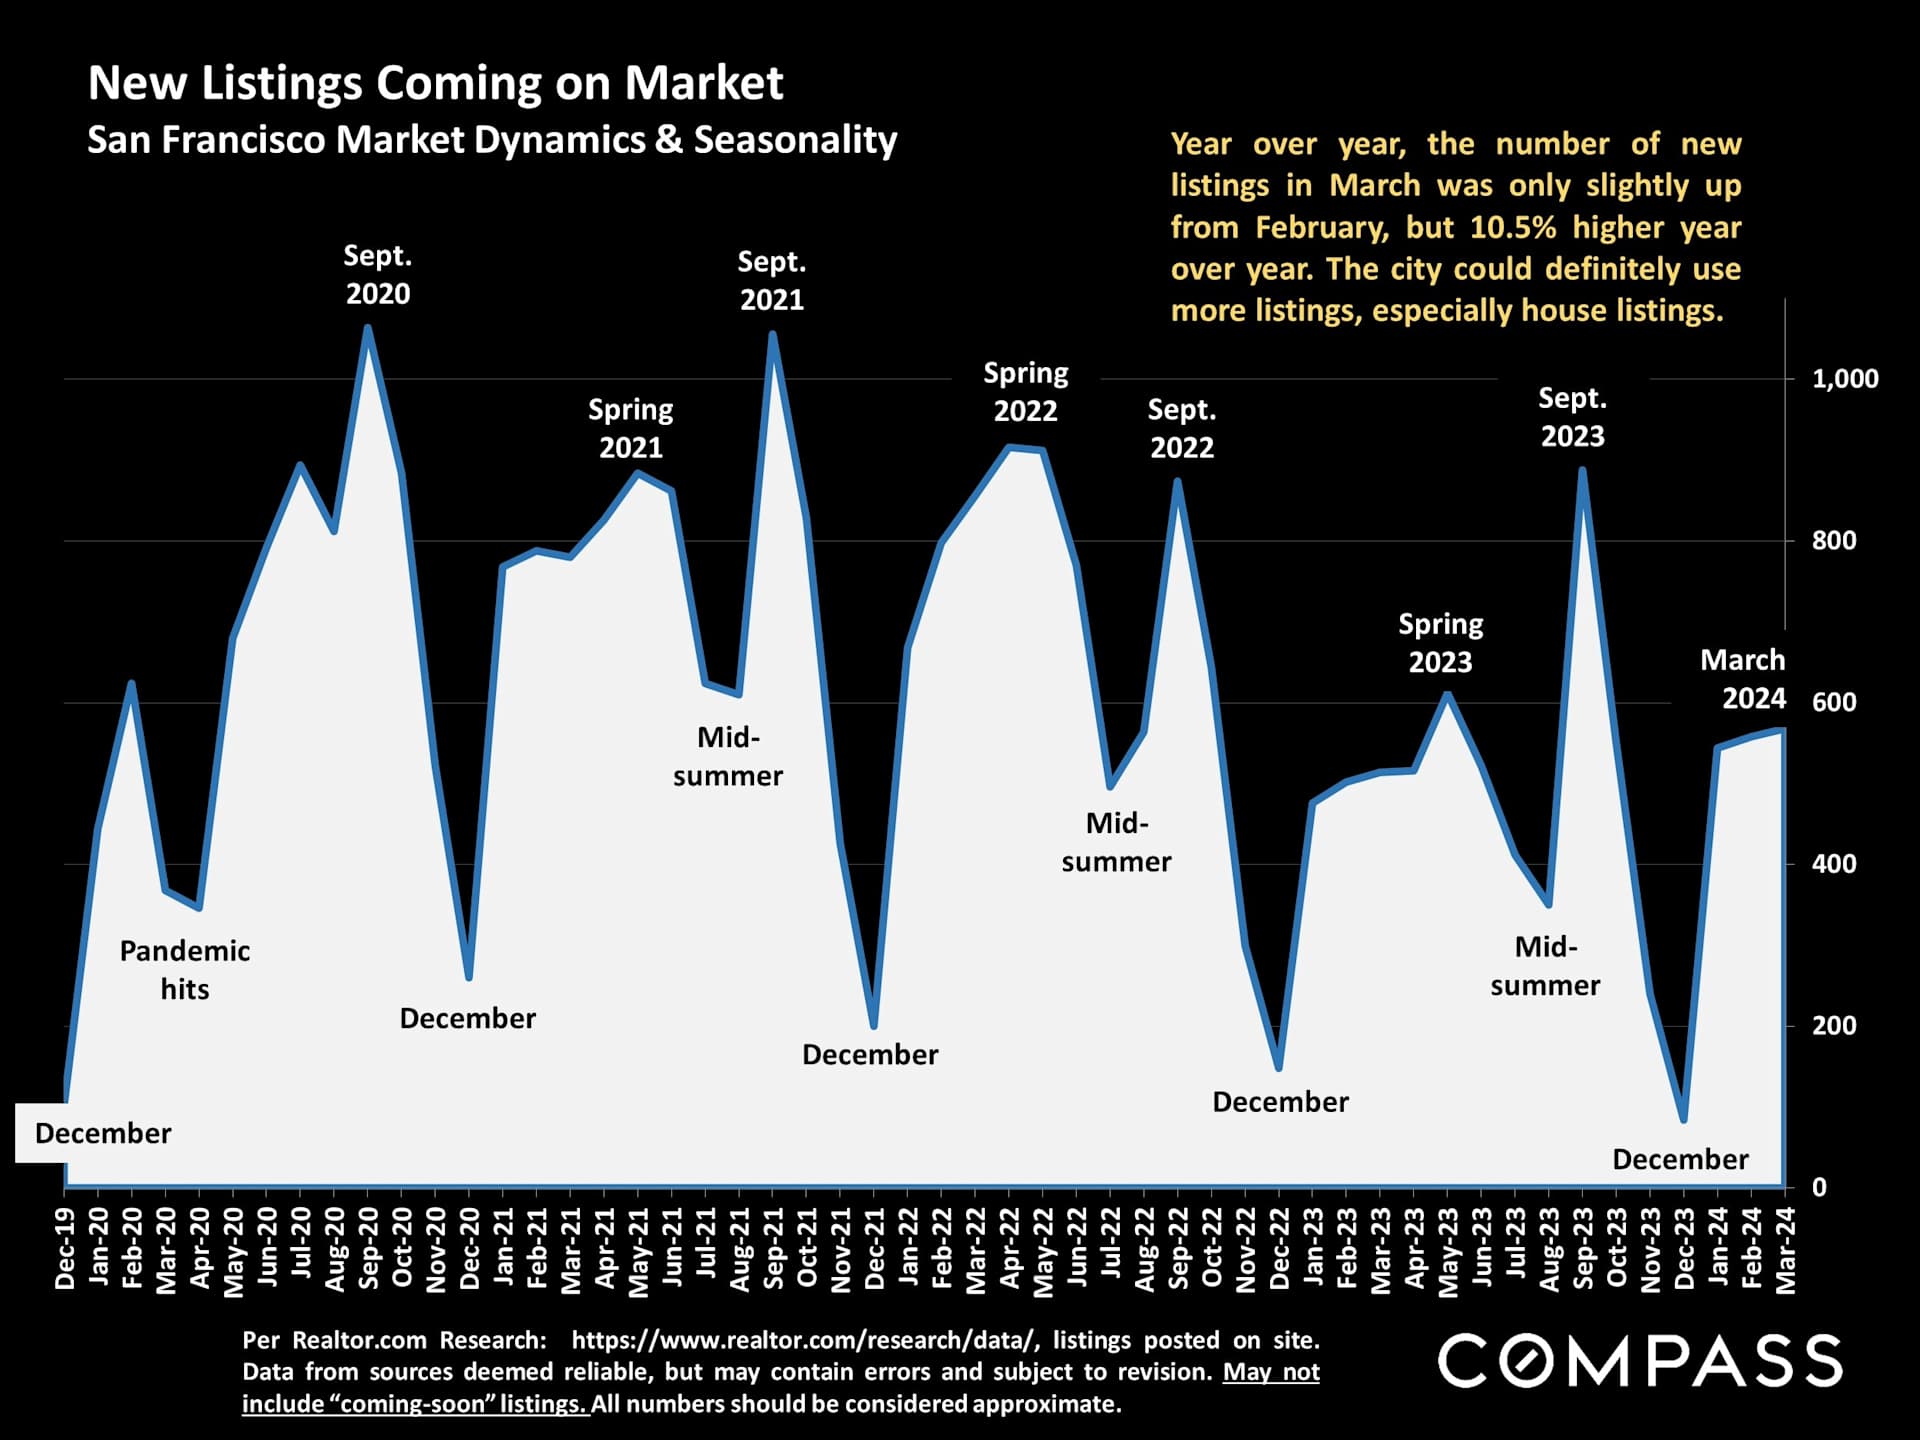
Chart of San Francisco new listings from December 2019 to March 2024, with recurring spring and September peaks.

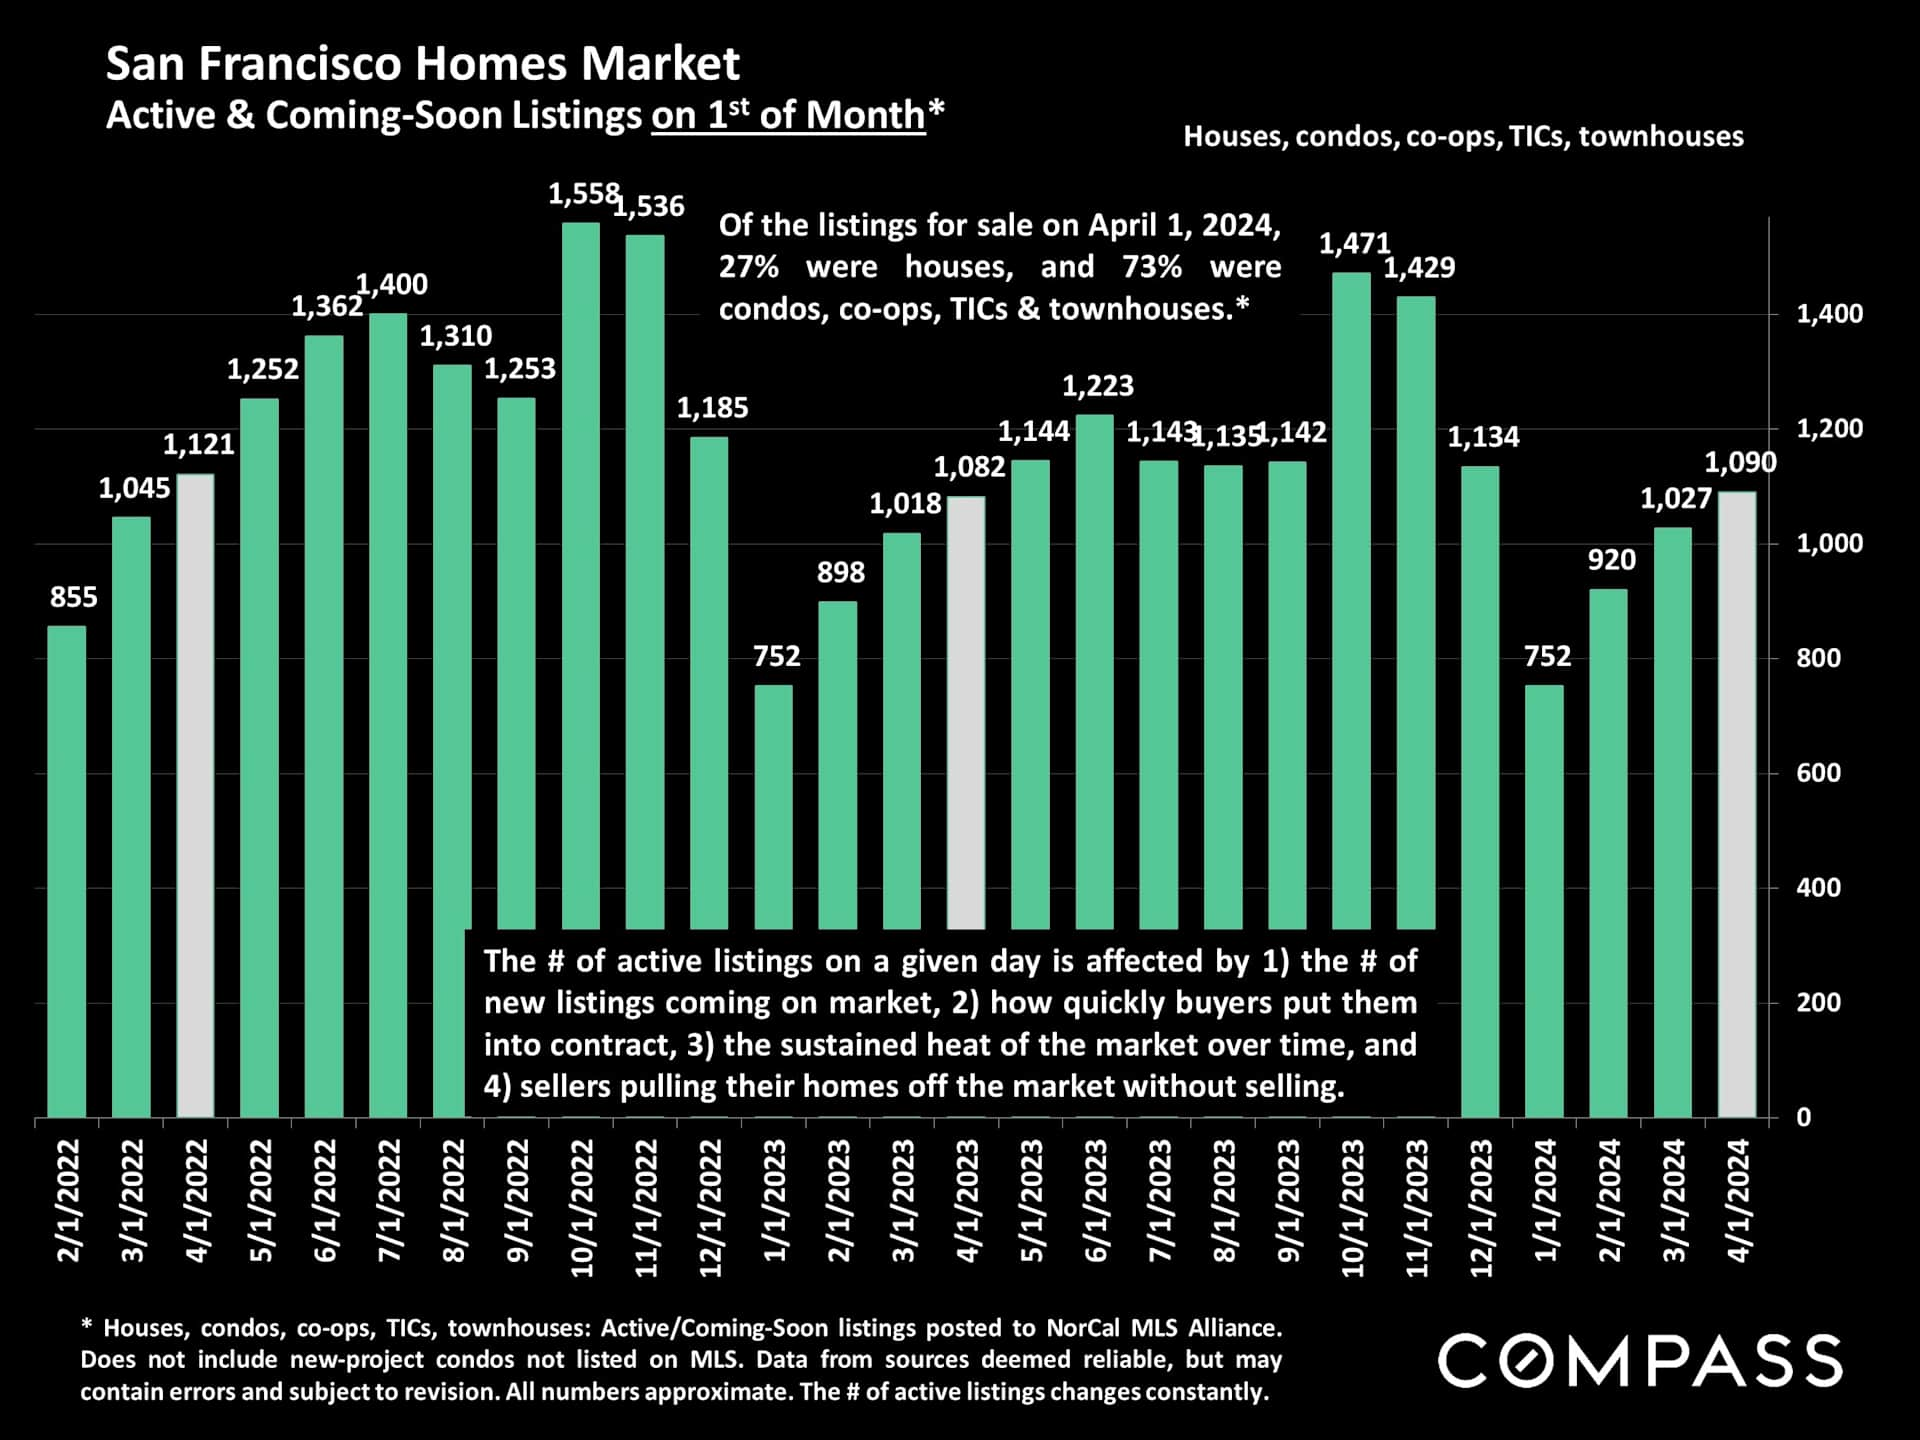
Bar chart of San Francisco active and coming-soon home listings, February 2022 to April 2024.

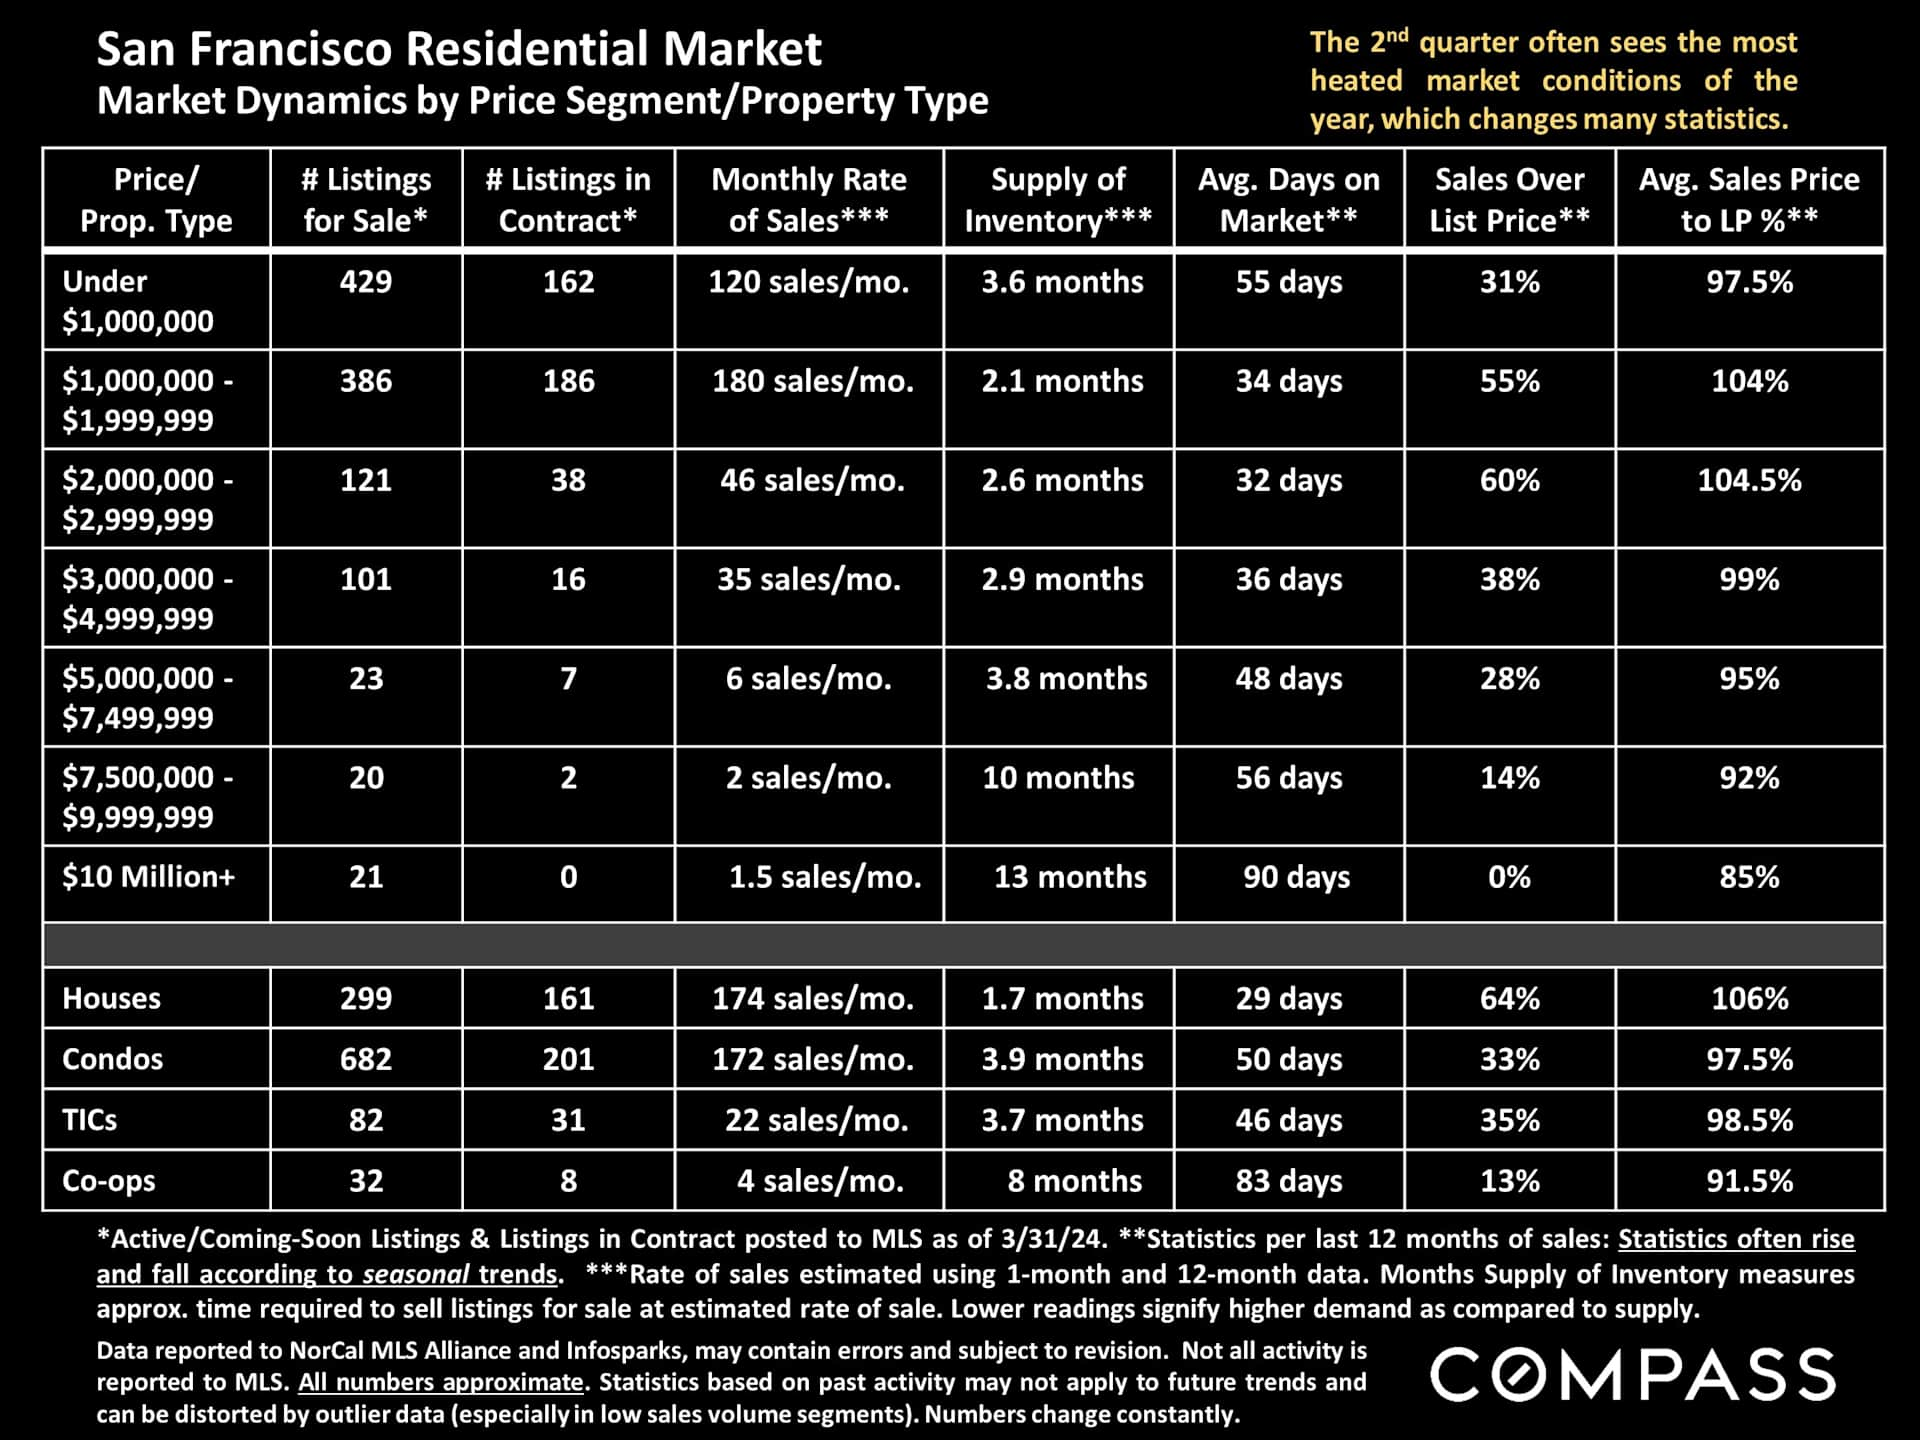
San Francisco residential market table comparing activity by price segment and property type.

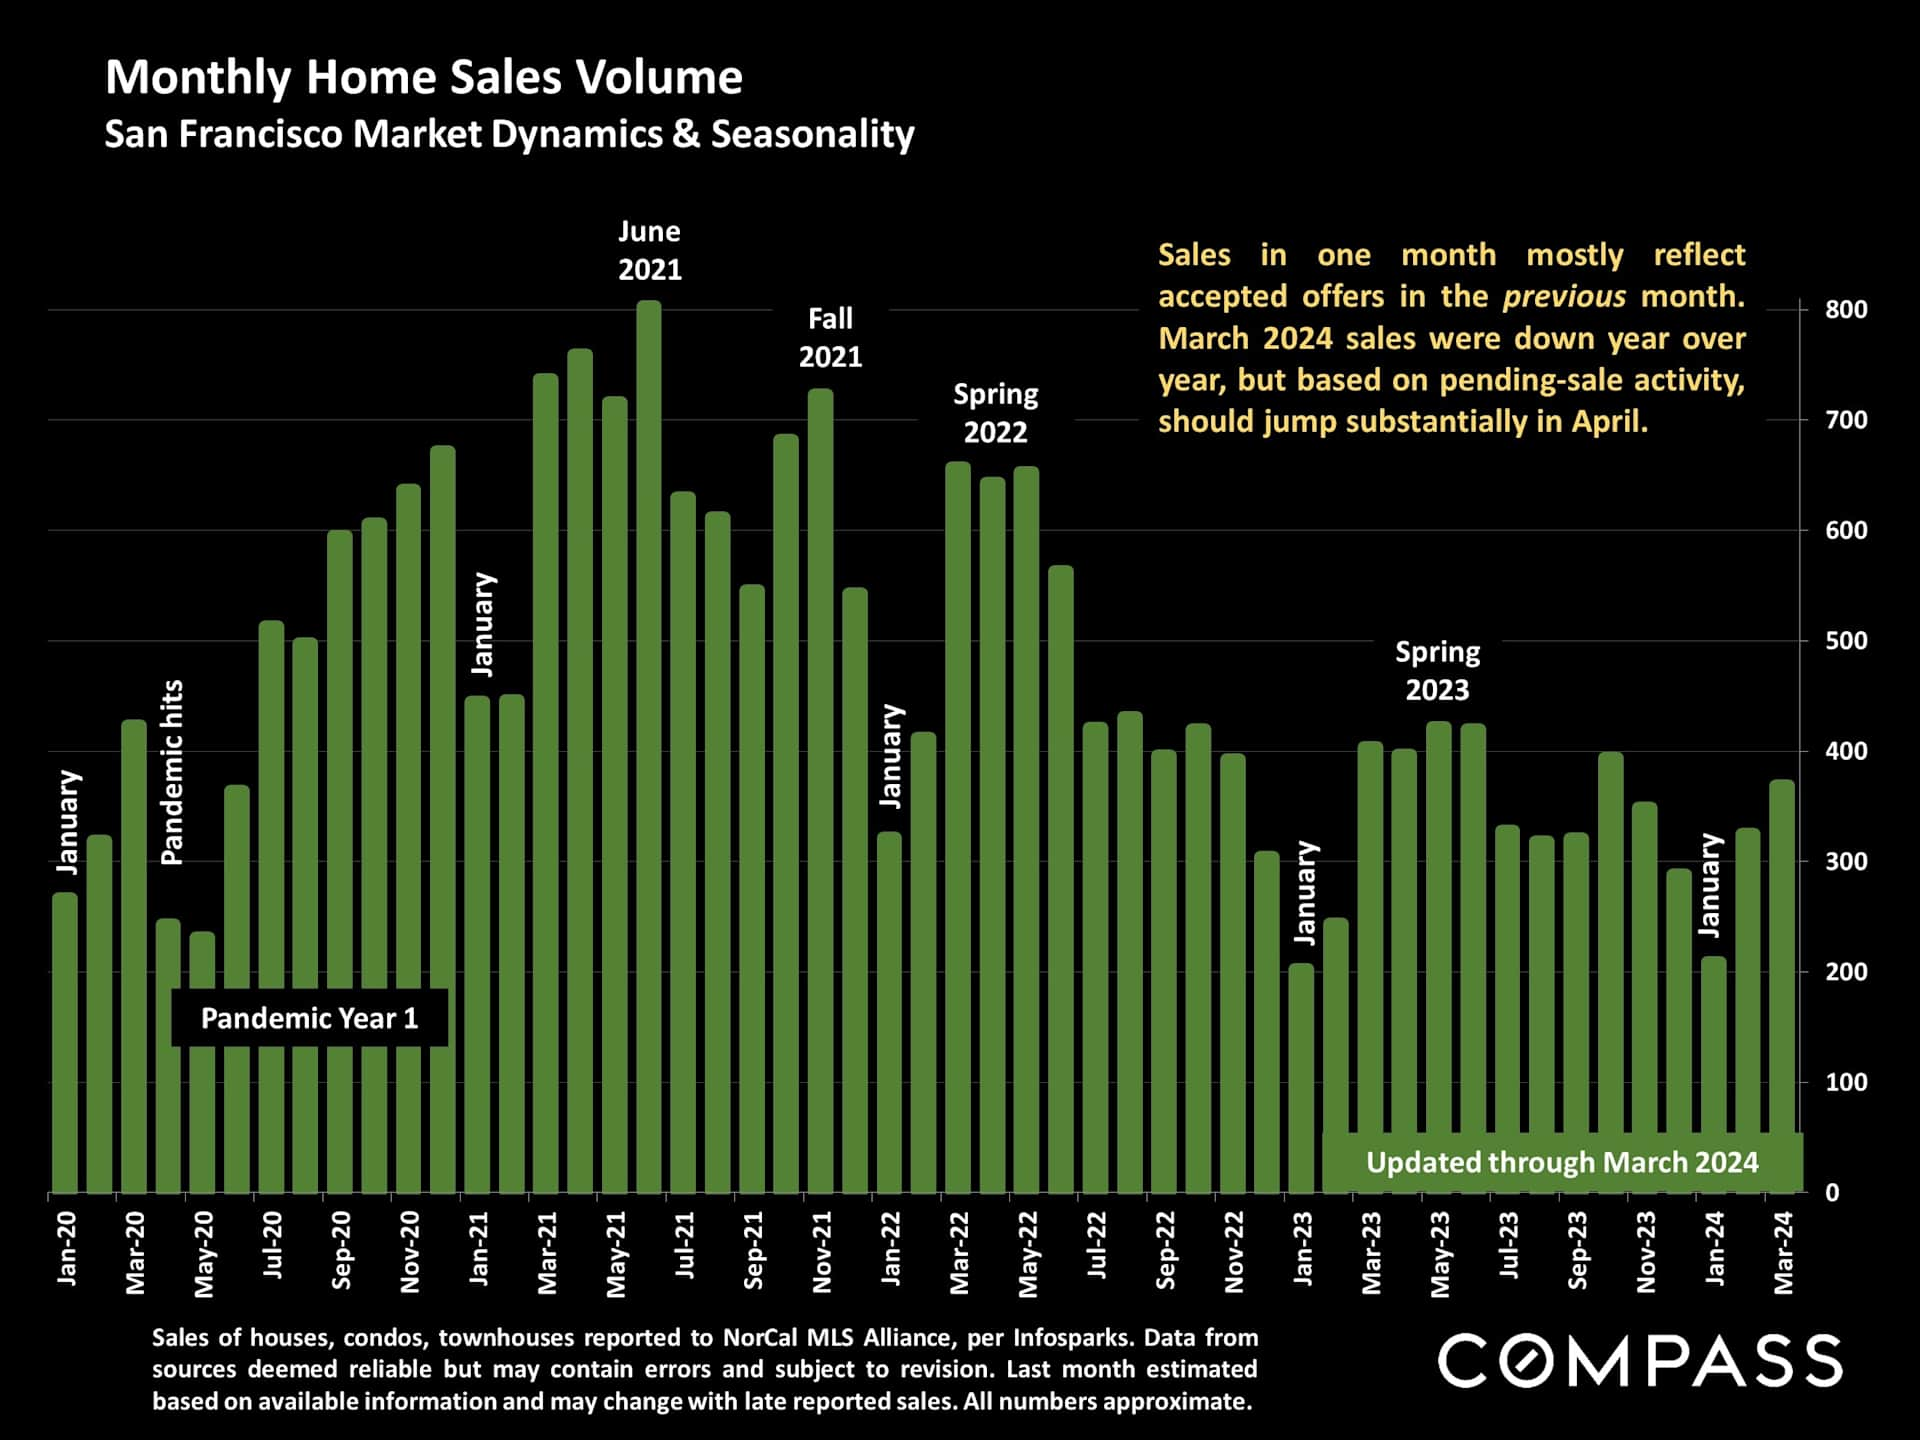
Bar chart of monthly San Francisco home sales, January 2020–March 2024, with a note predicting an April increase.

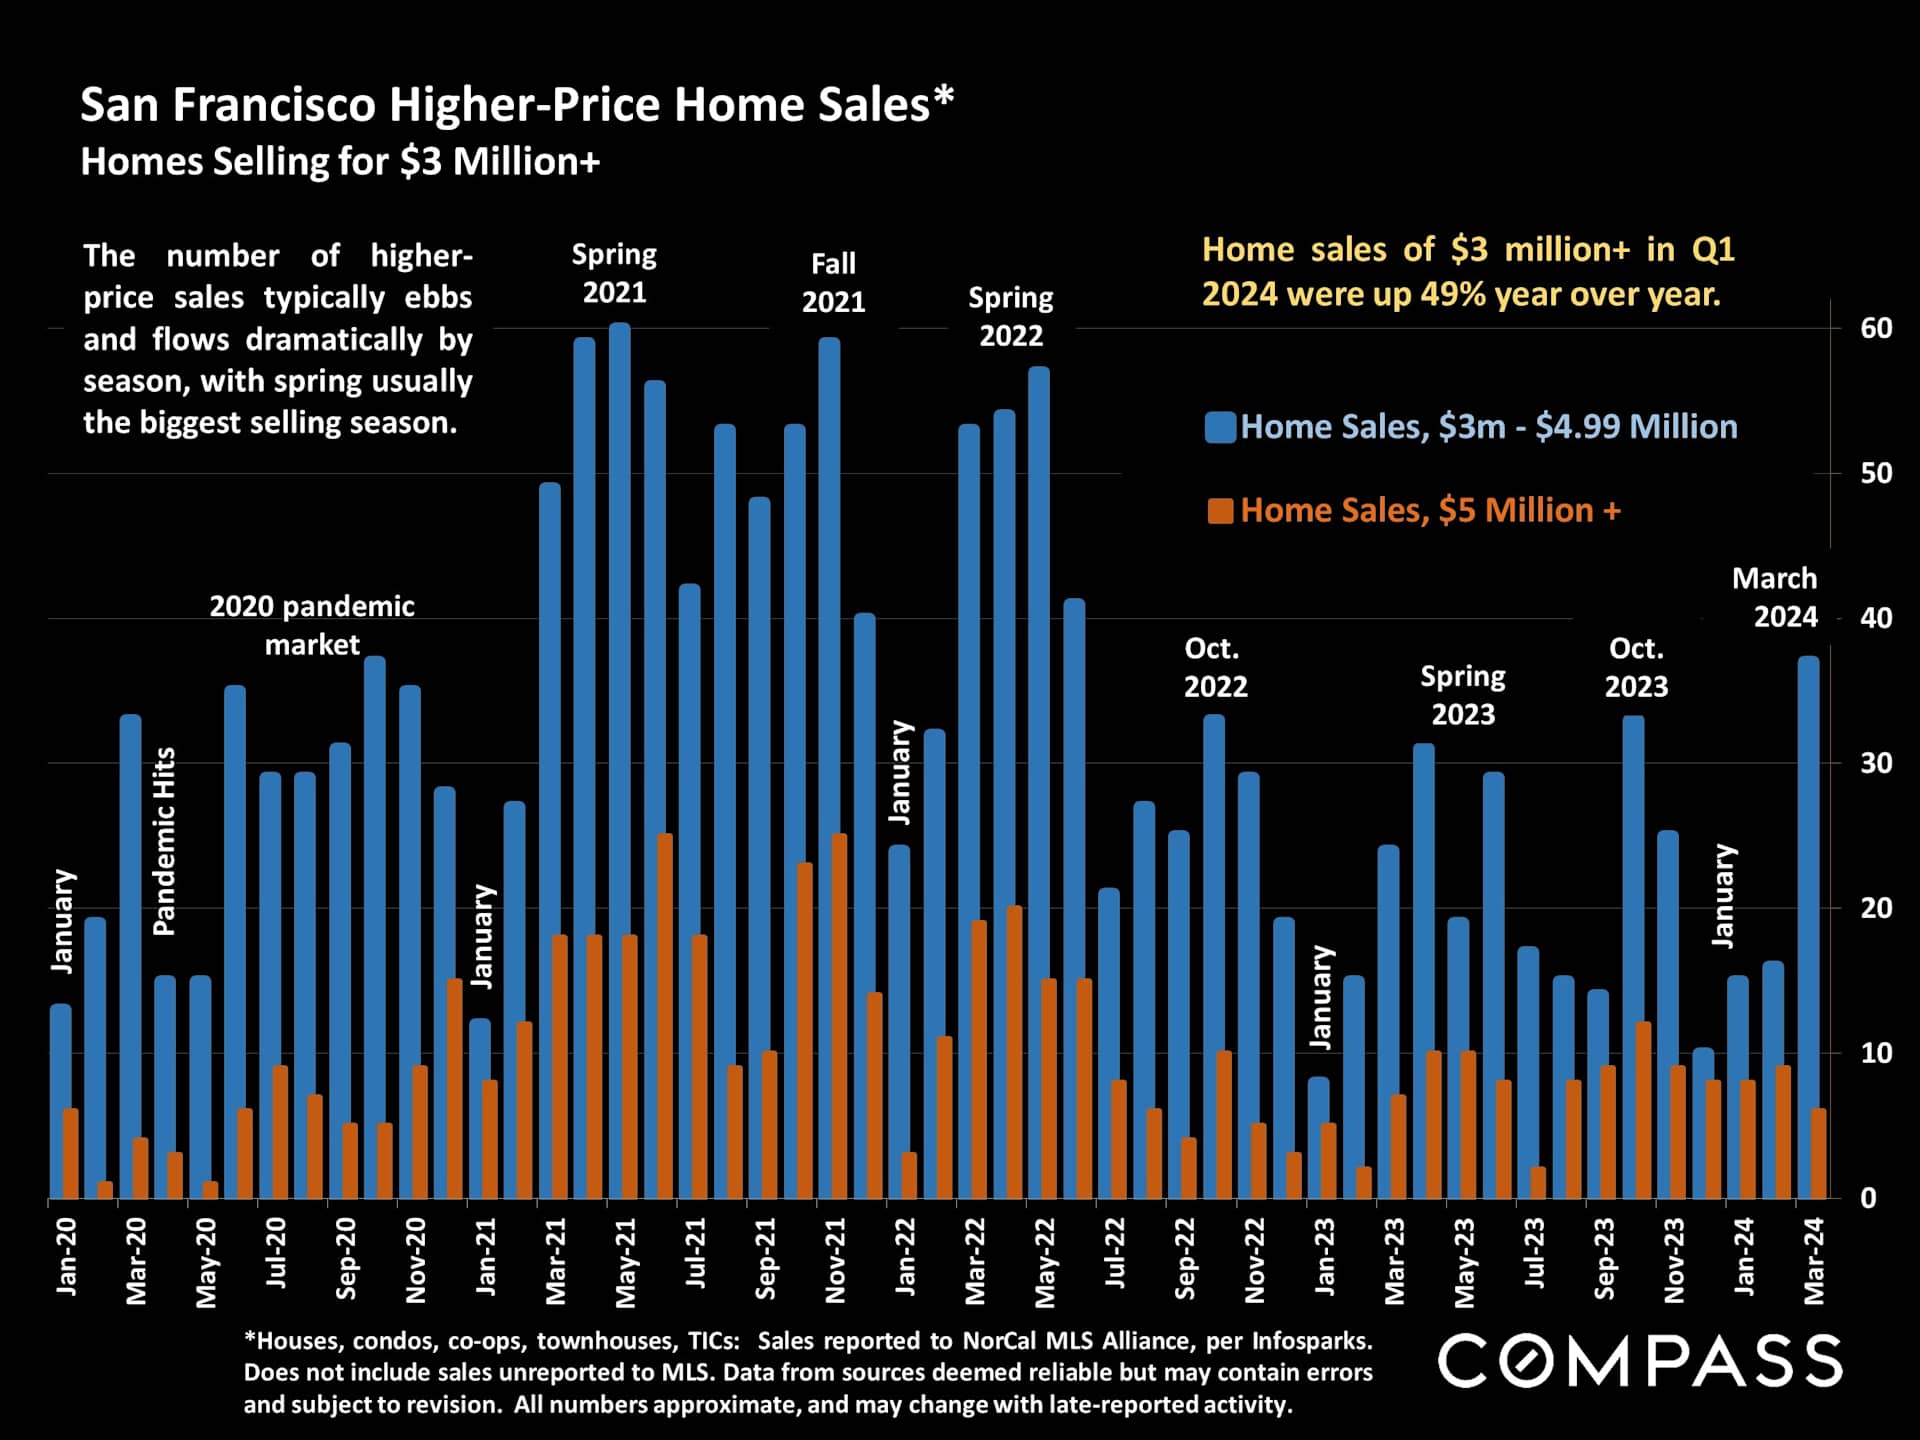
Chart of monthly San Francisco home sales over $3 million, with sales counts by price band from 2020 to March 2024.

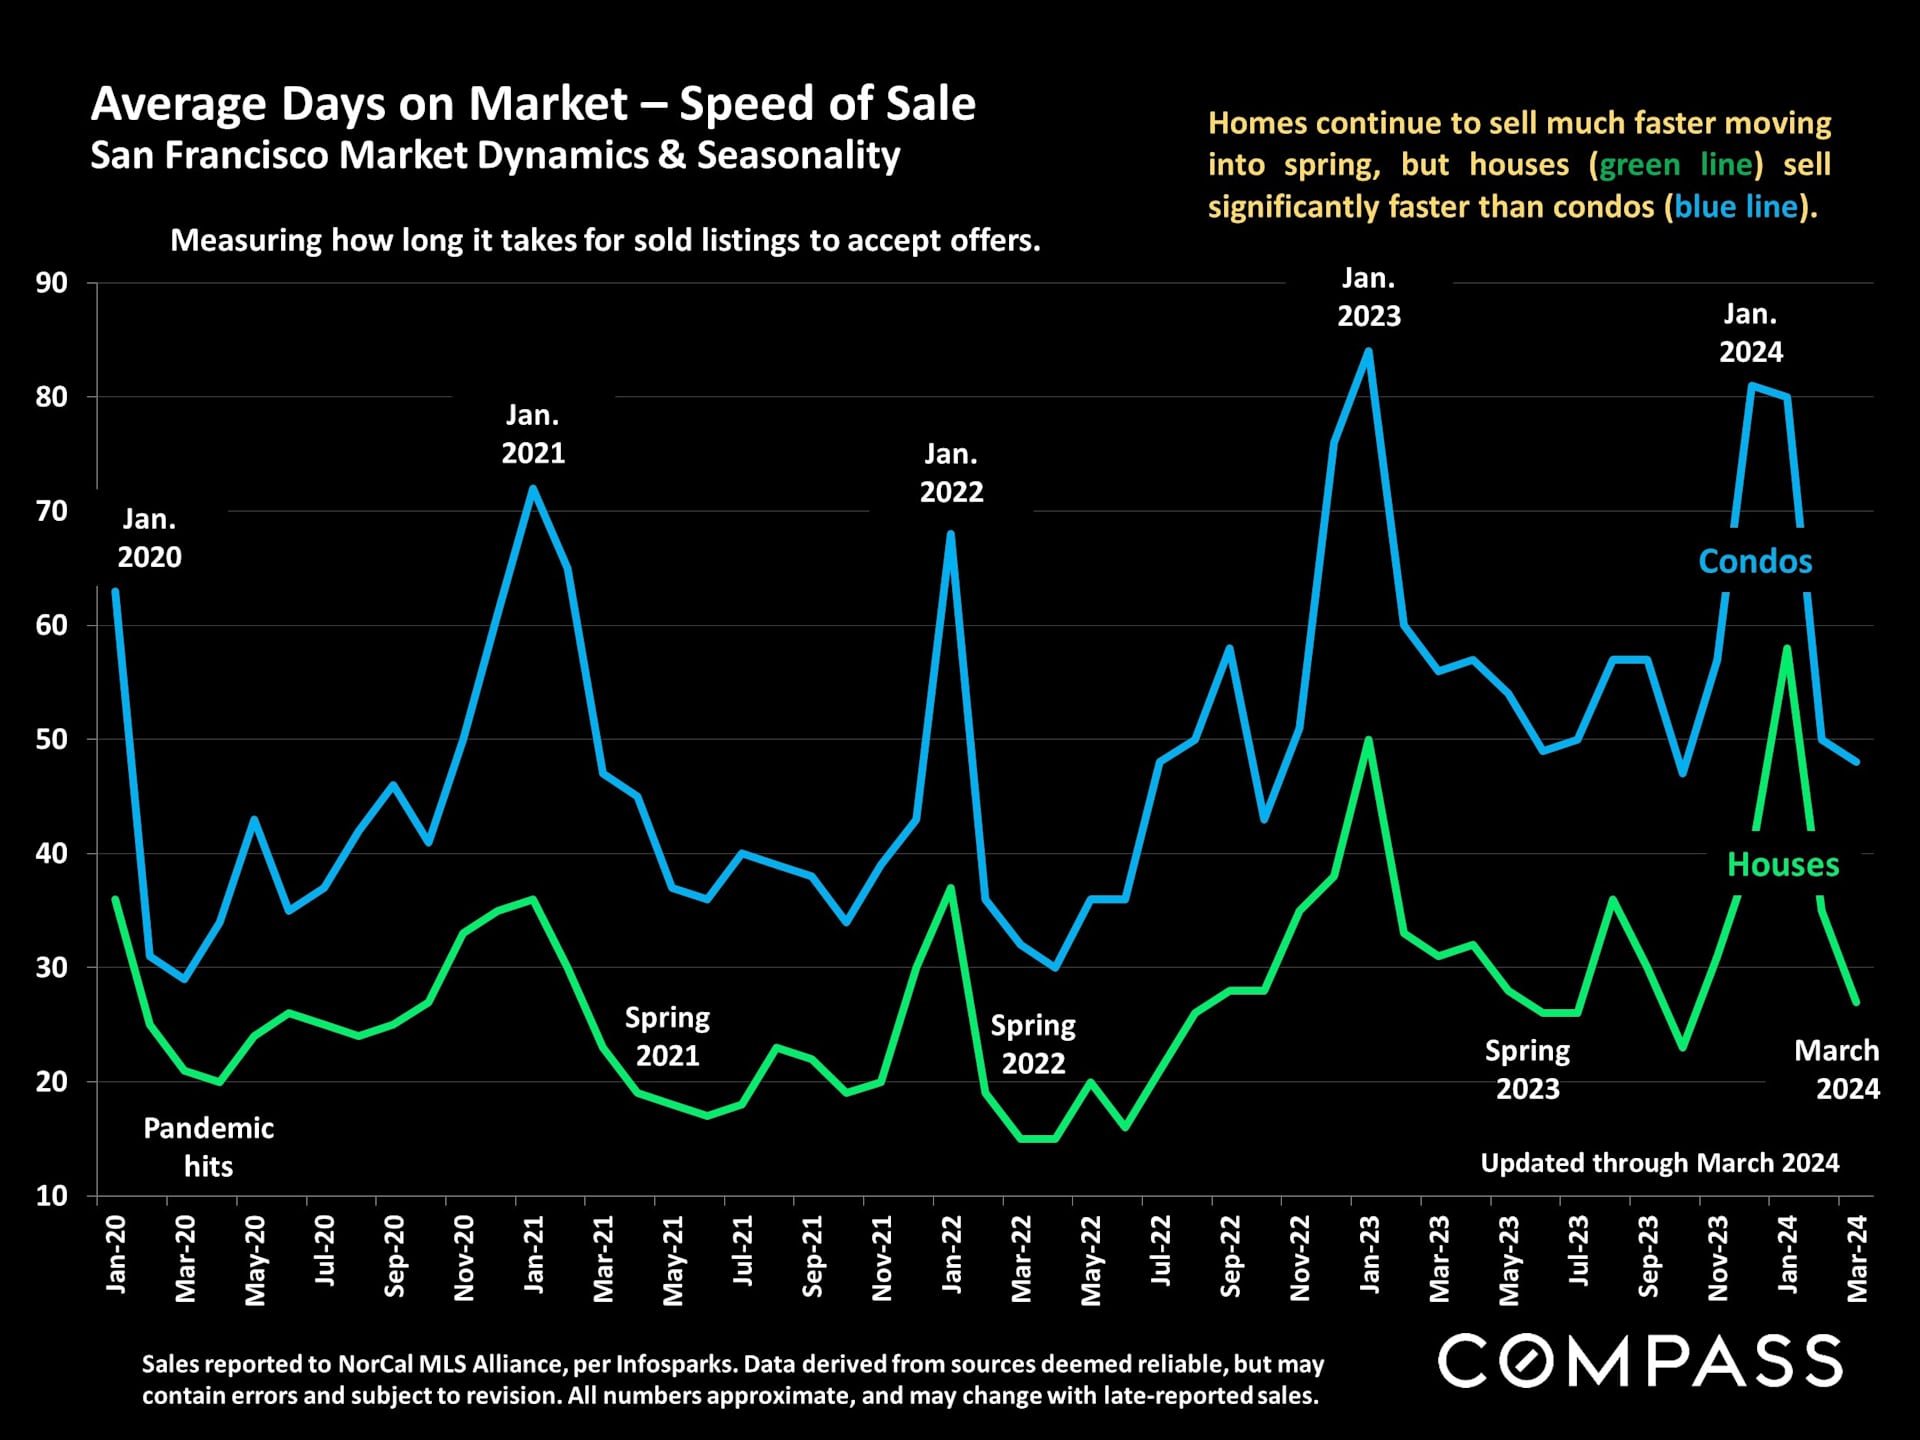
Chart comparing San Francisco days on market for houses and condos, with houses generally selling faster through March 2024.

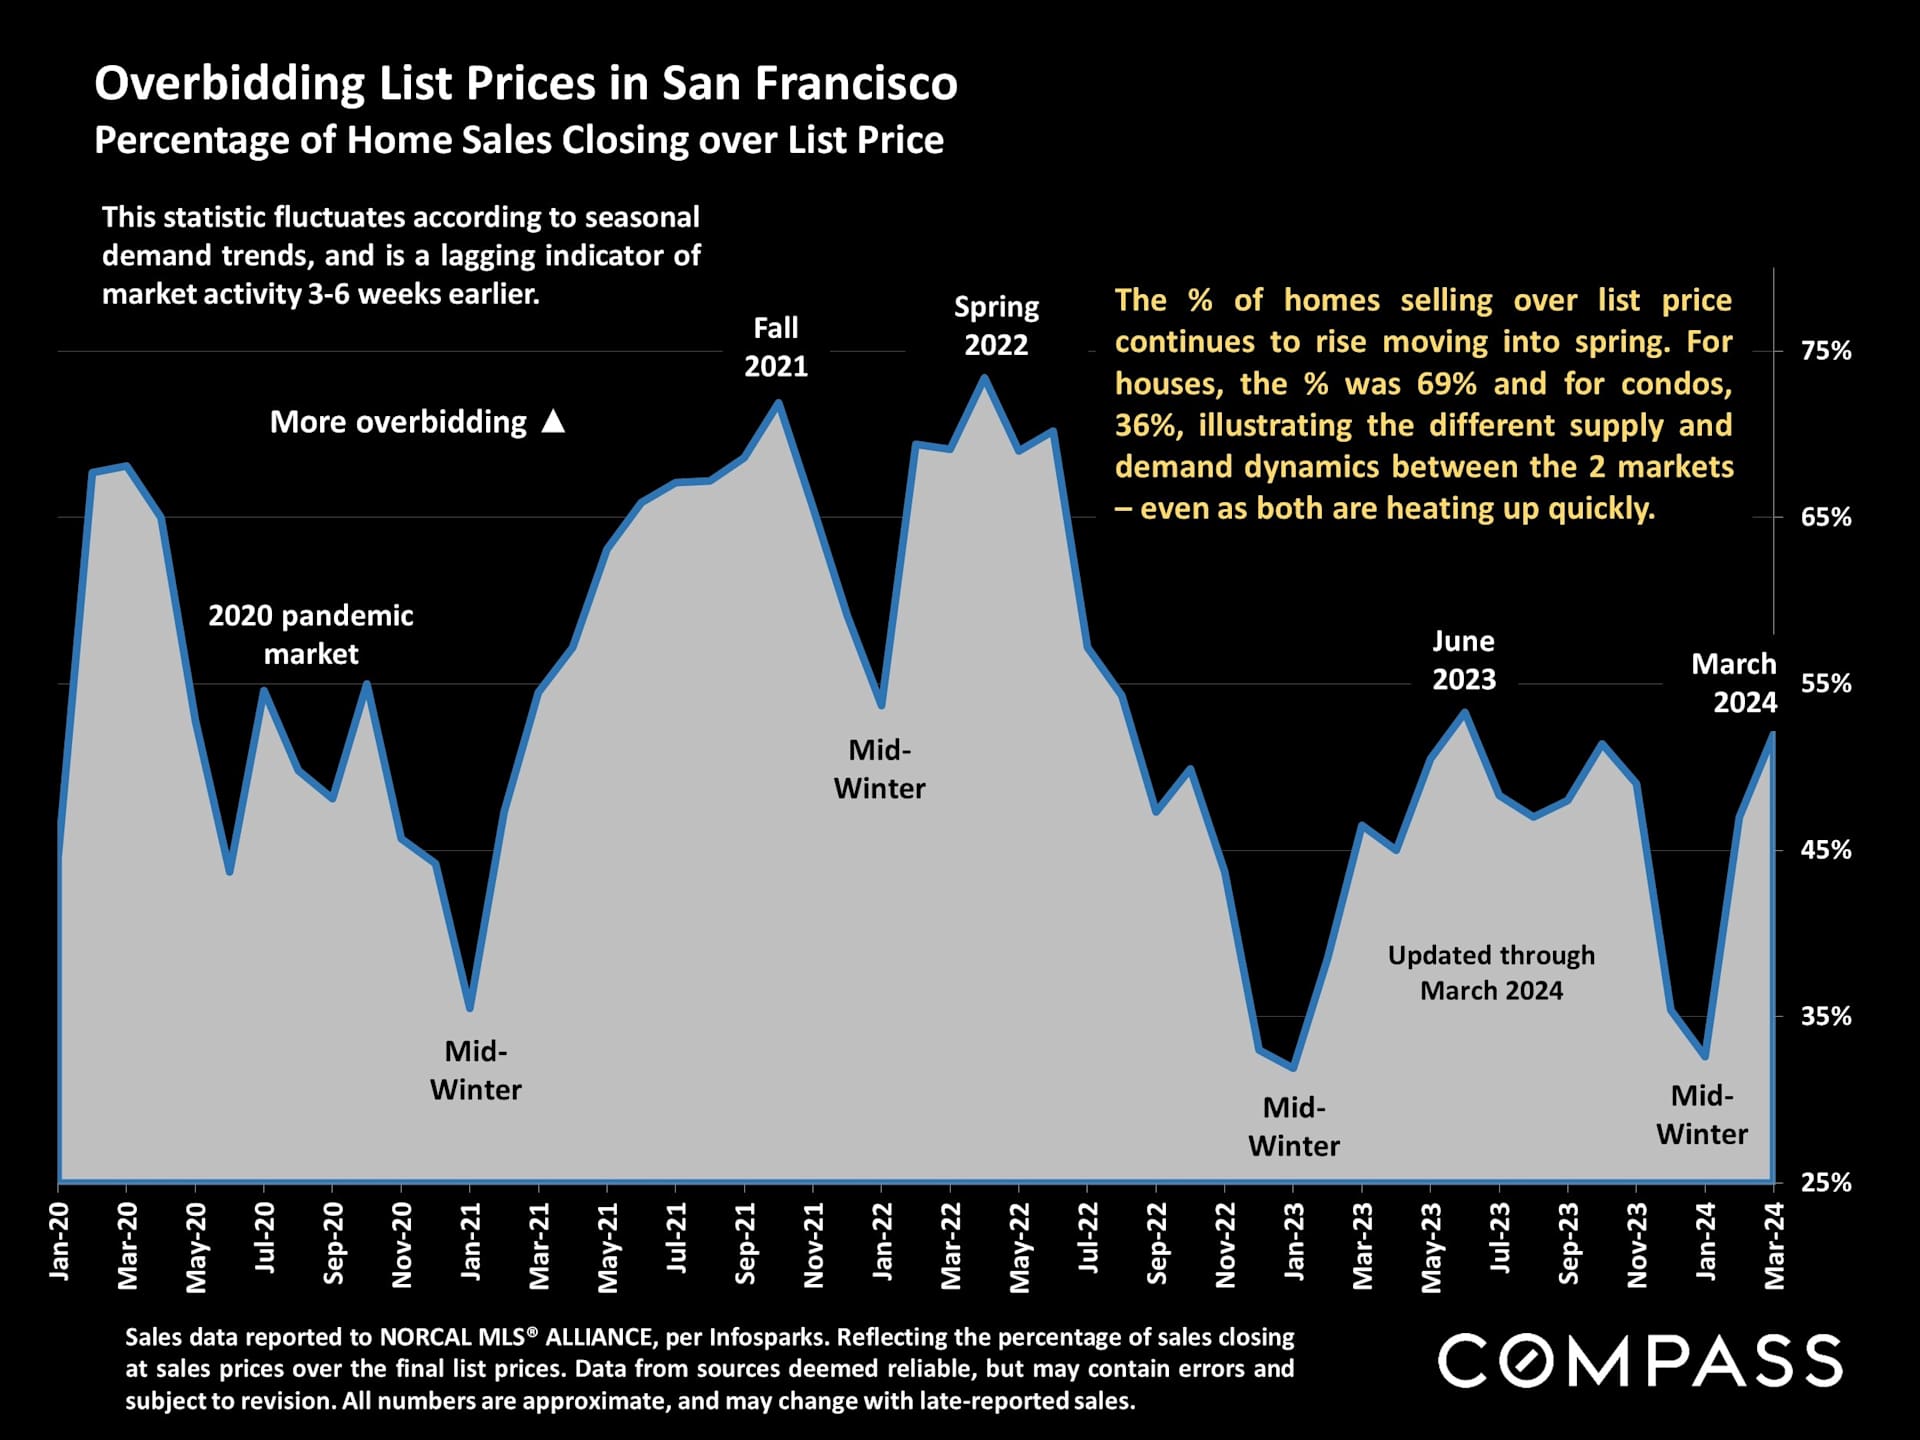
San Francisco chart of home sales closing over list price, showing seasonal fluctuations through March 2024.


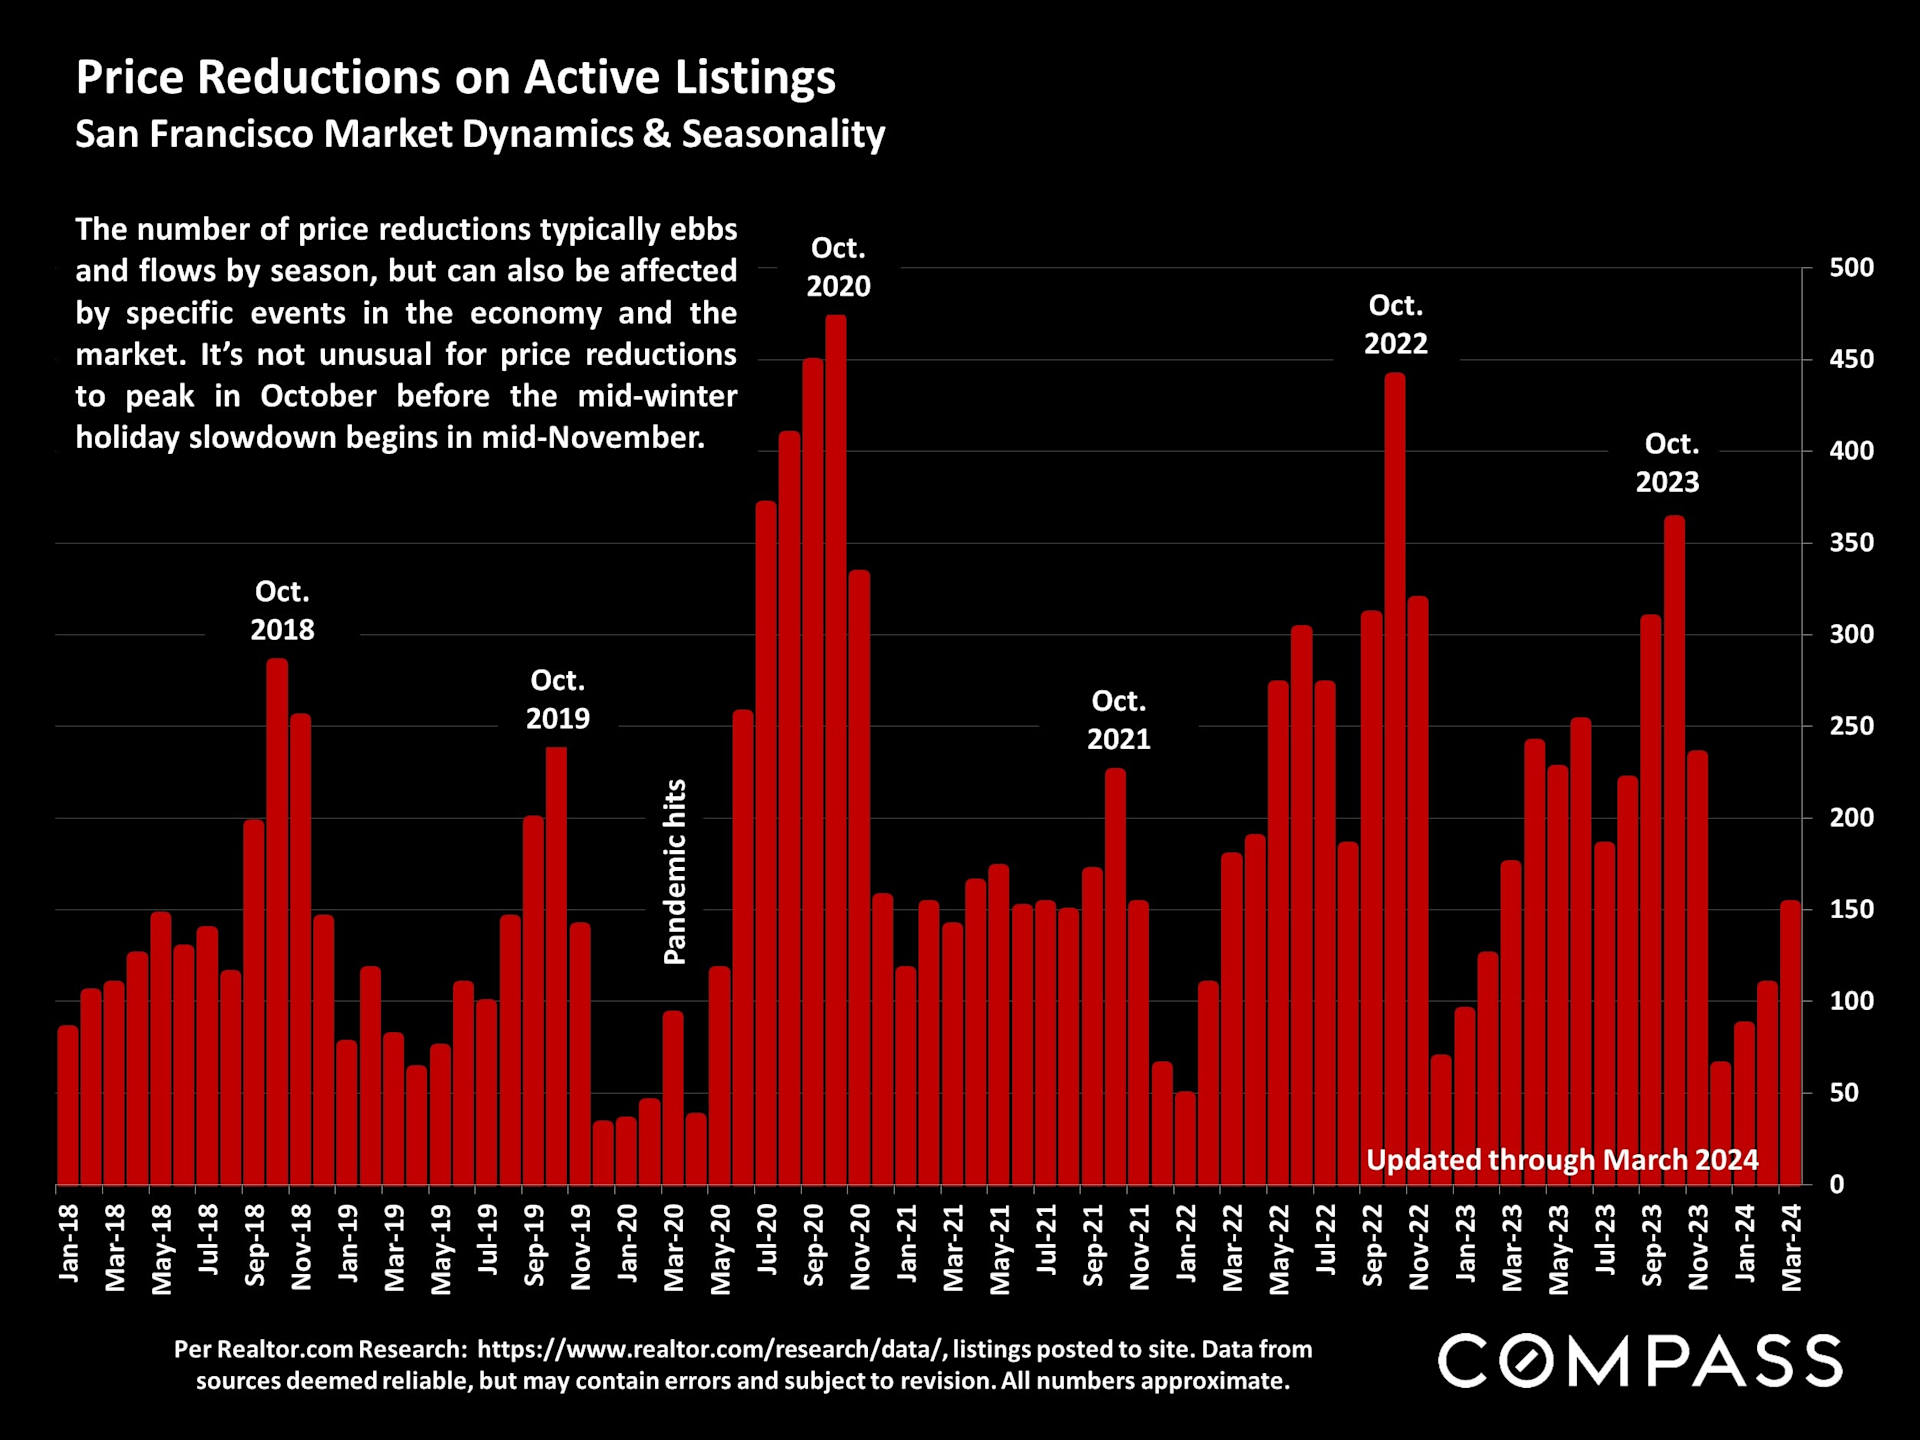
Chart of monthly San Francisco active-listing price reductions from 2018 to March 2024, with October peaks and a 2020 spike.

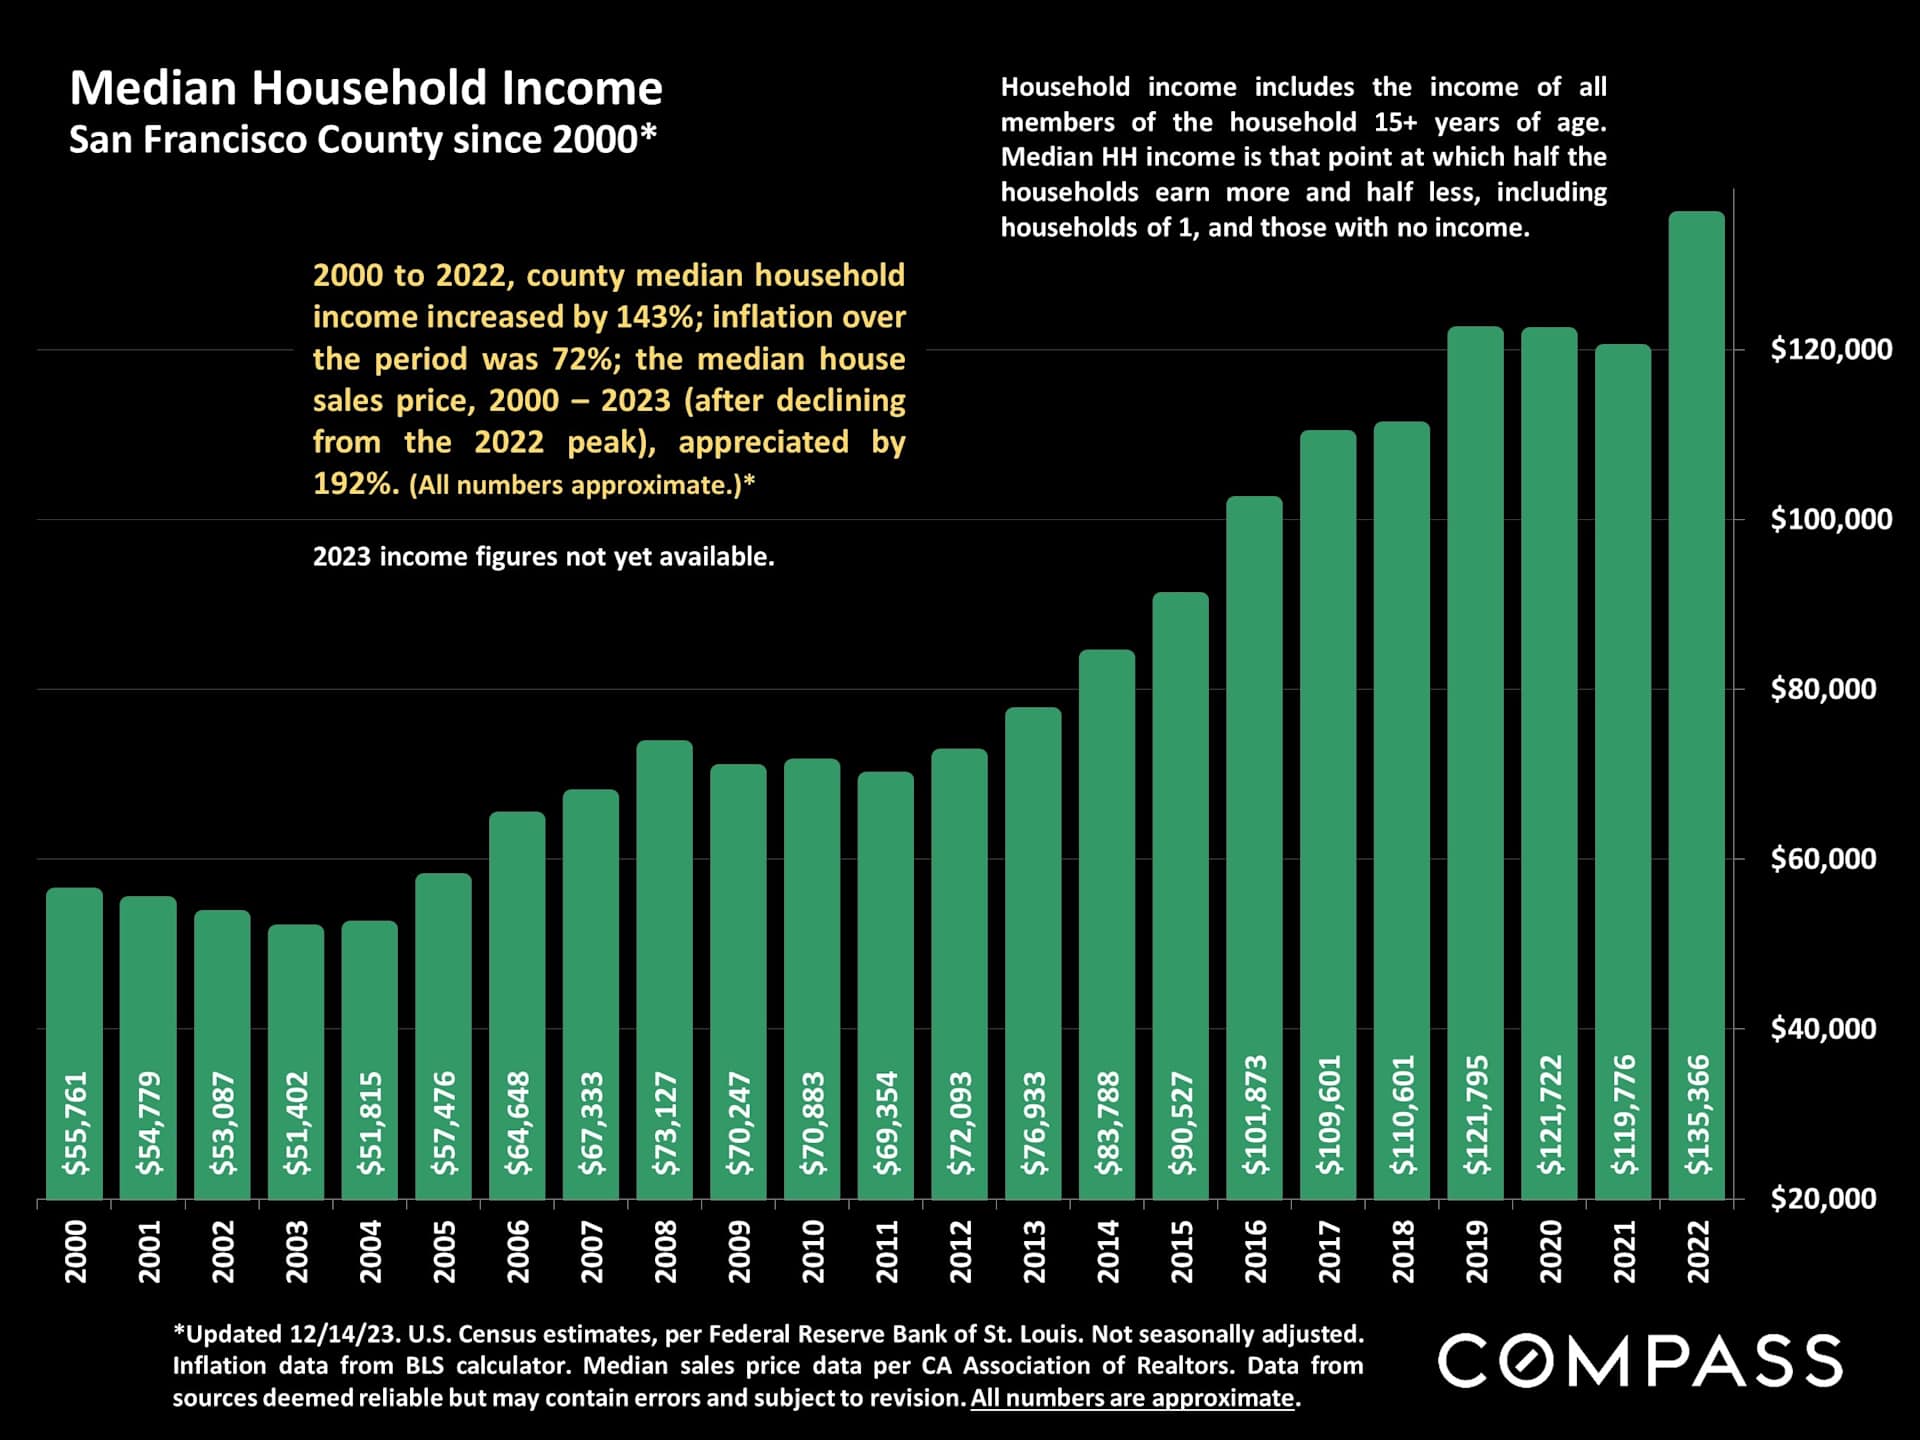
Chart of San Francisco County median household income from 2000 to 2022, rising to $135,366.

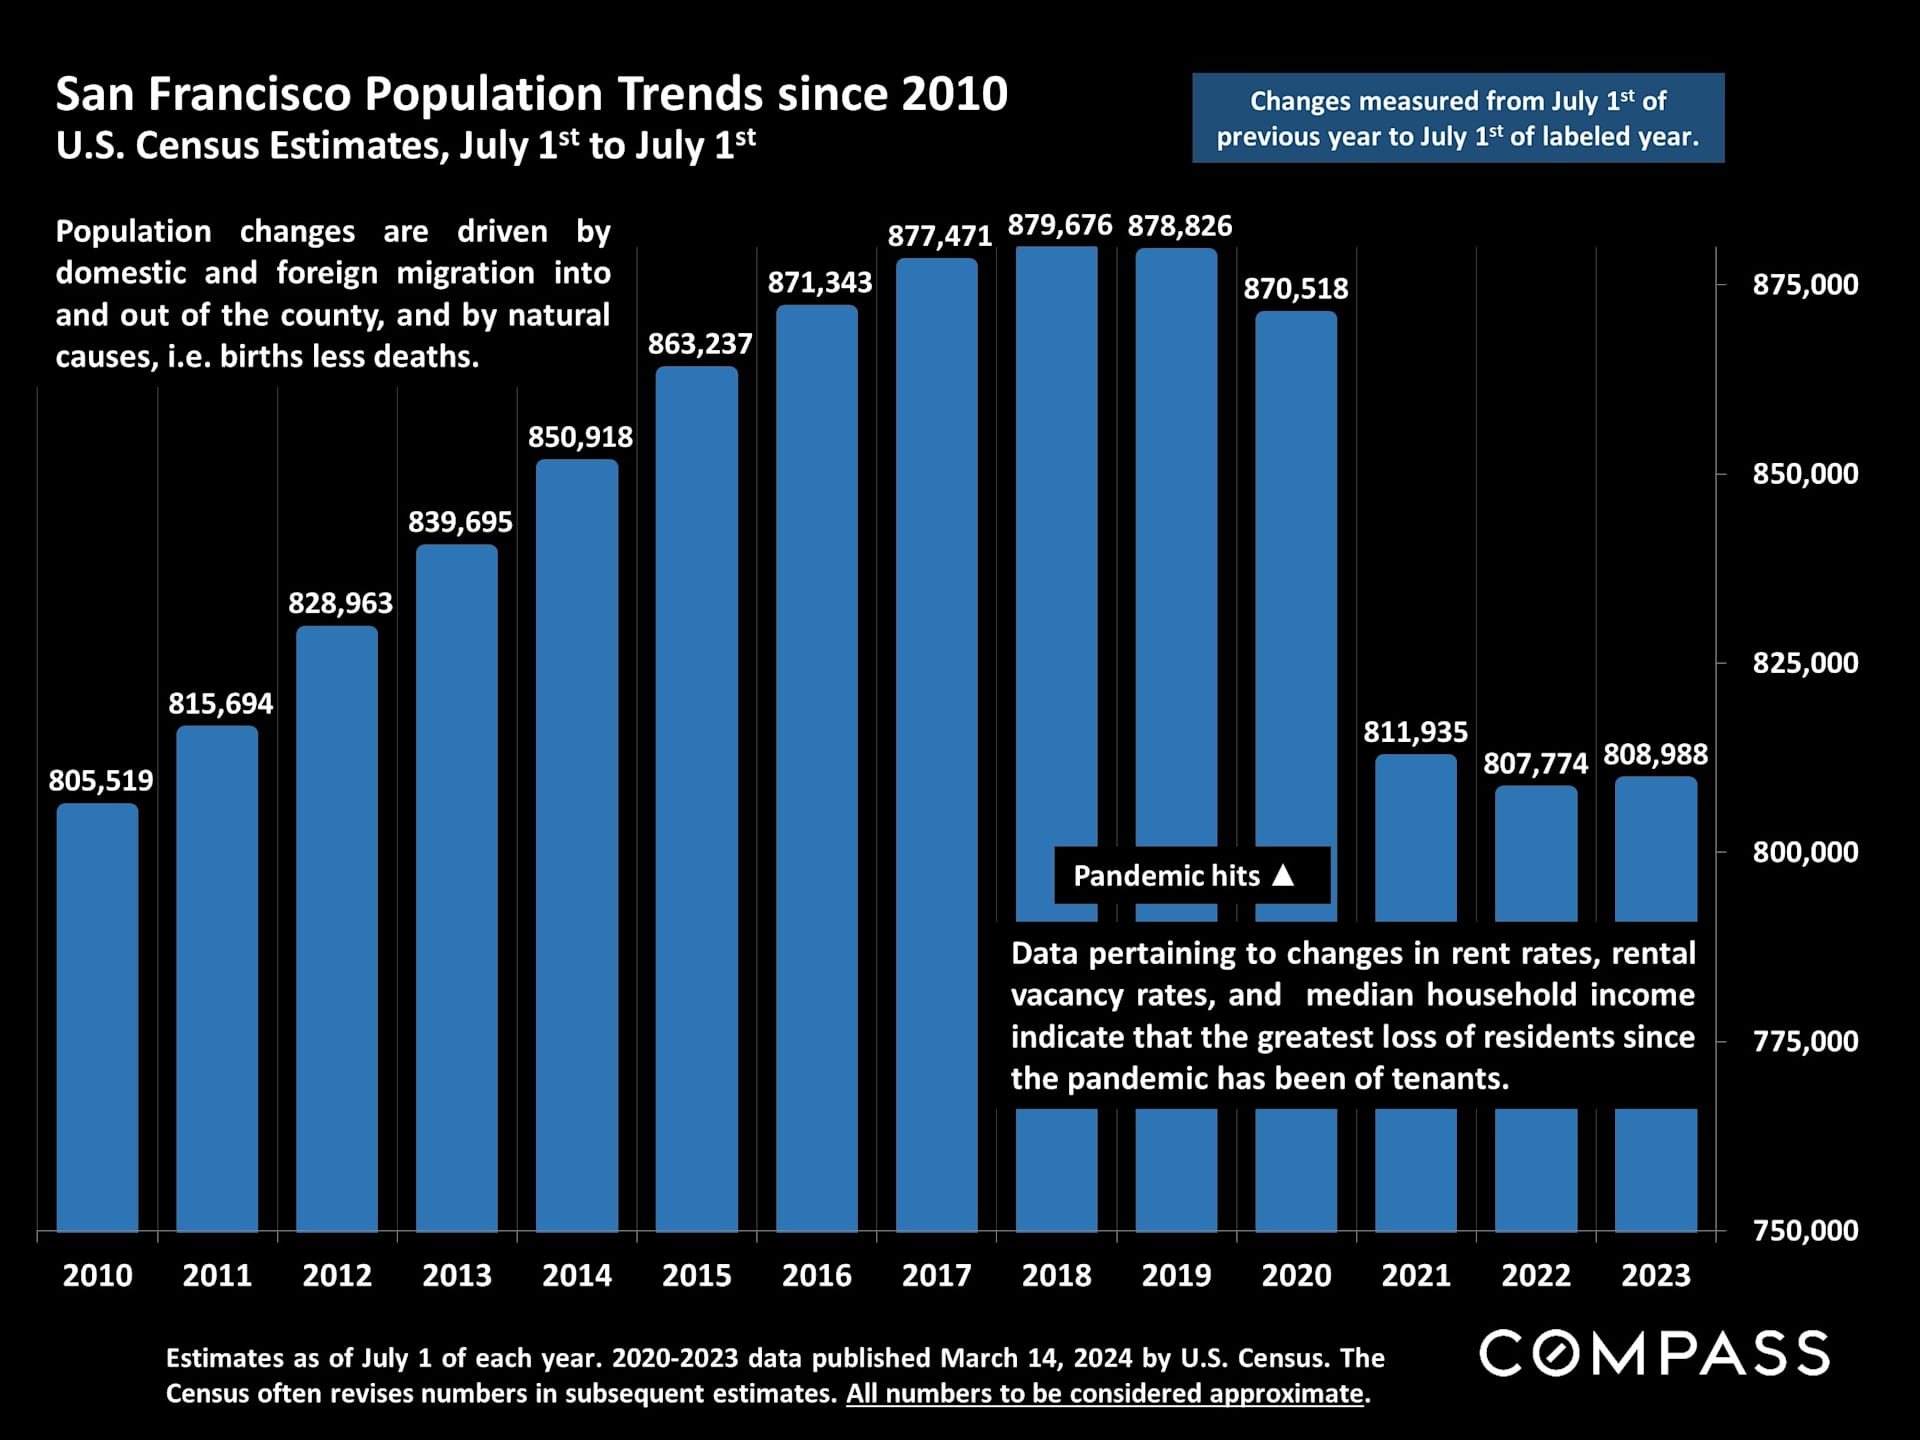
San Francisco population trends, 2010–2023: blue bars peak in 2018 before falling after the pandemic.

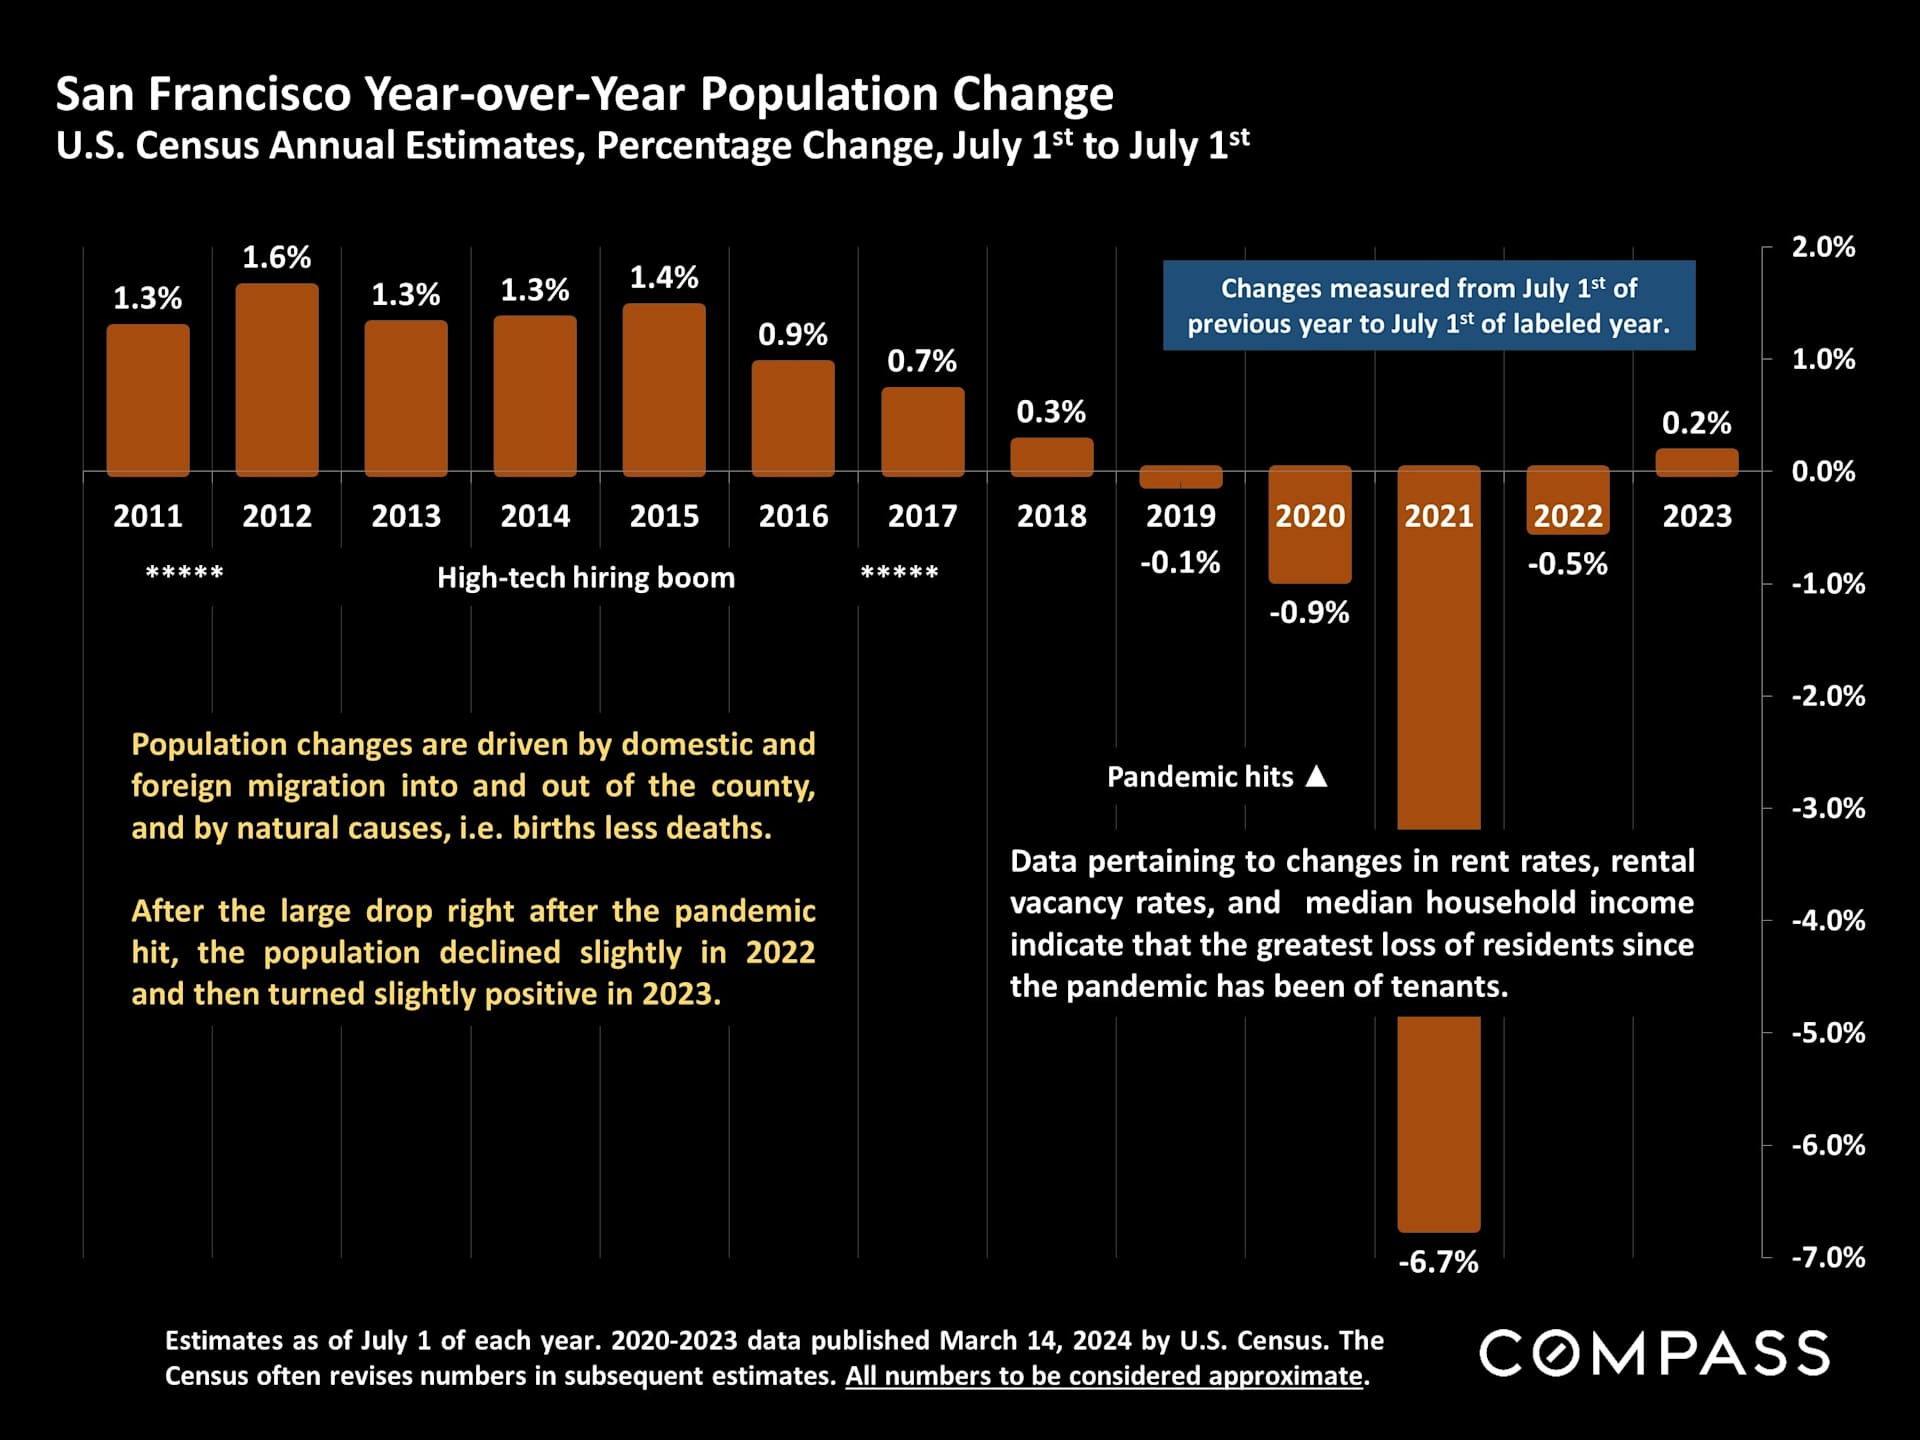
Chart of San Francisco’s annual population change, with a 6.7% decline in 2021 and slight growth in 2023.

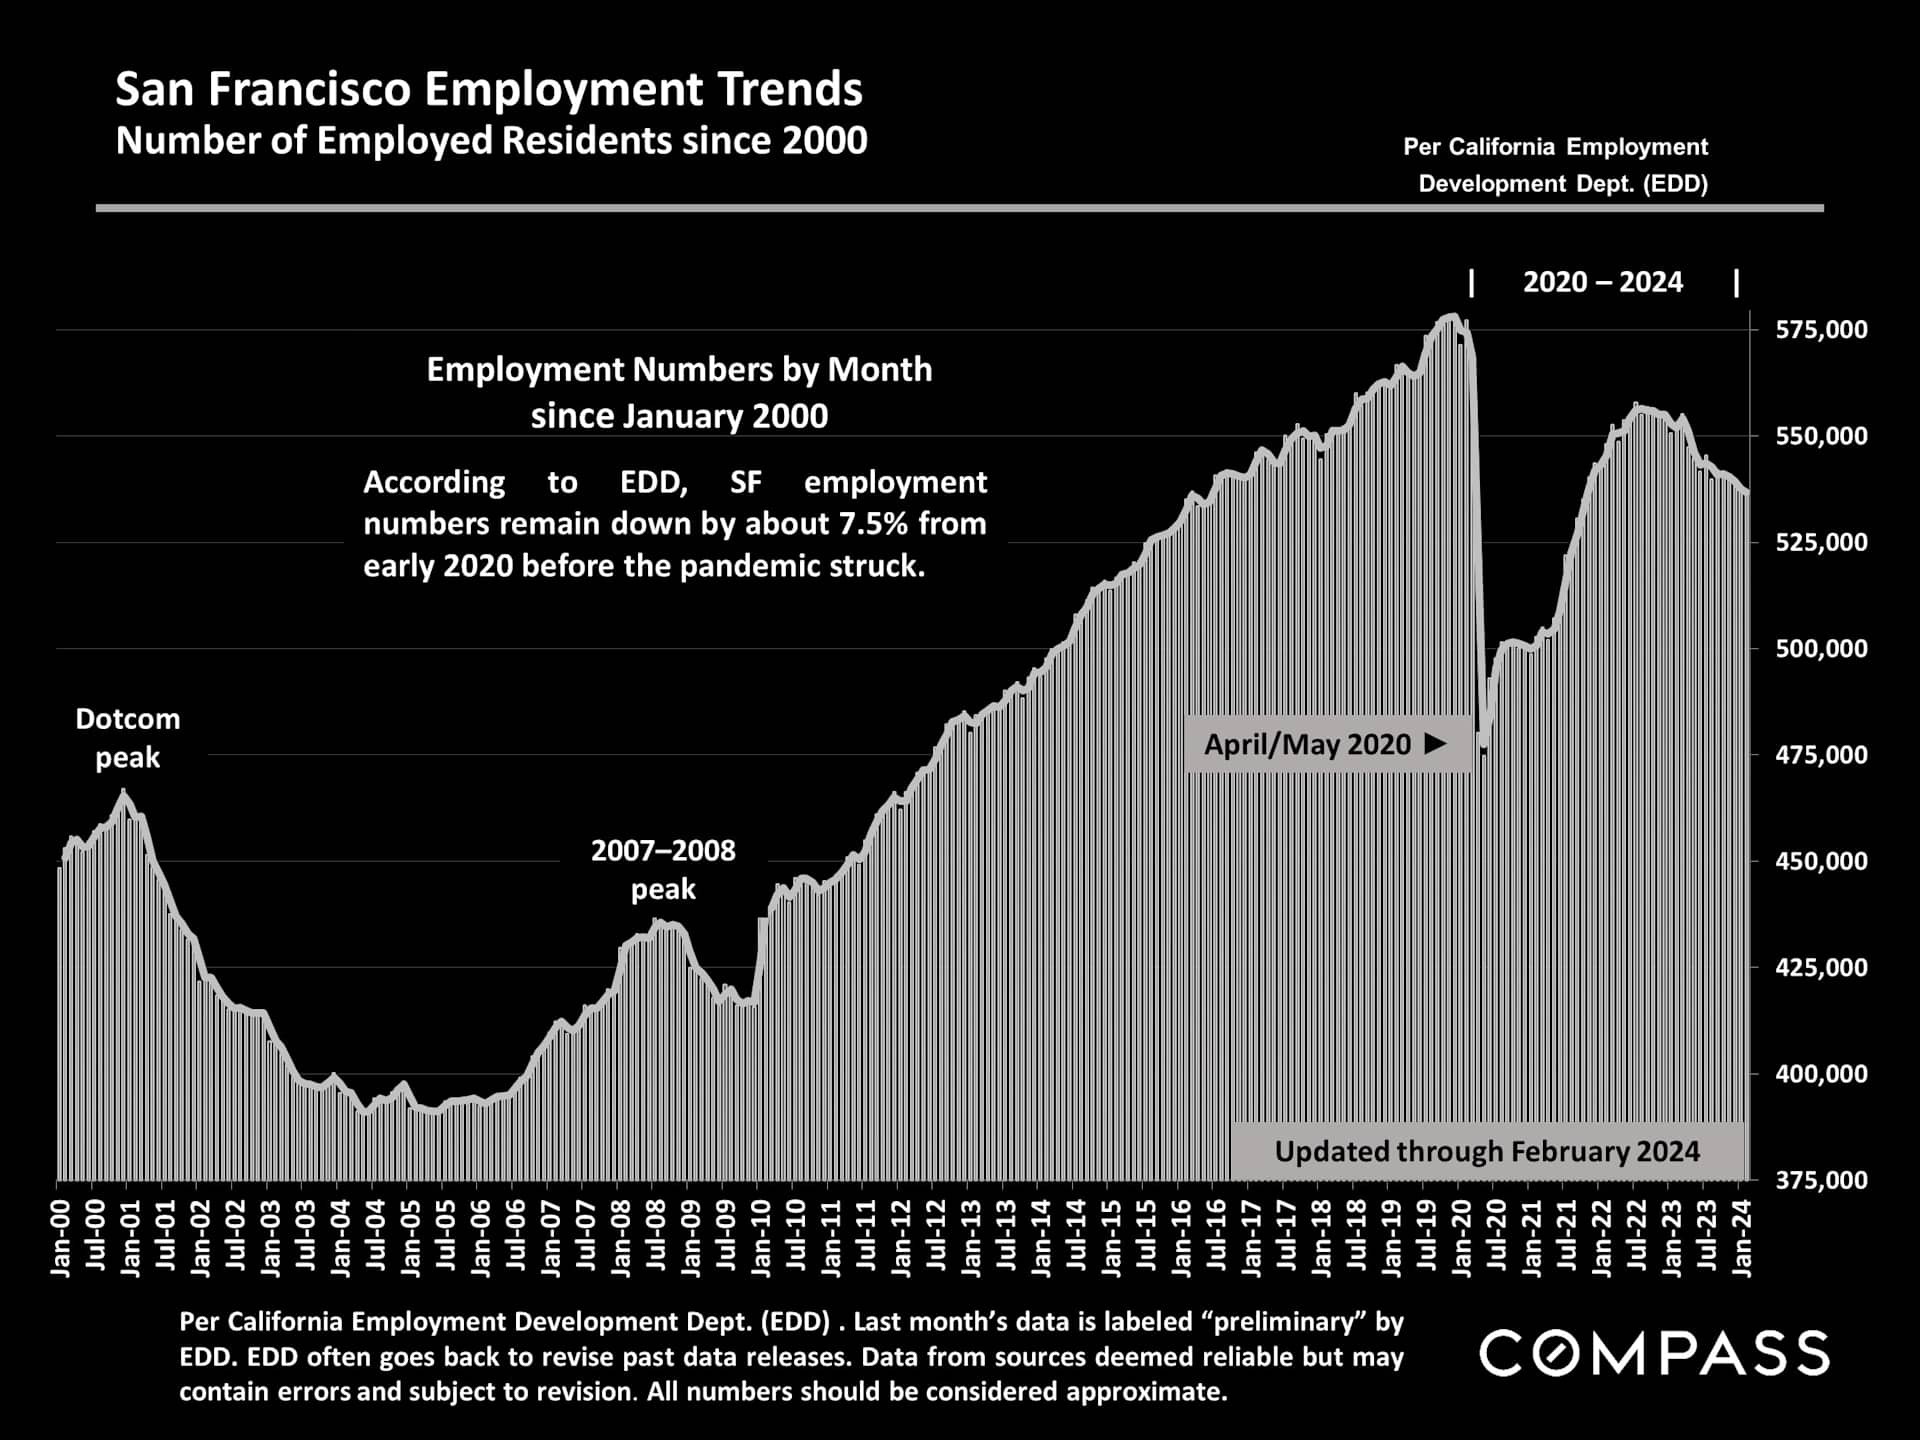
Chart of San Francisco employment trends from 2000 through February 2024, with a sharp pandemic-era drop.

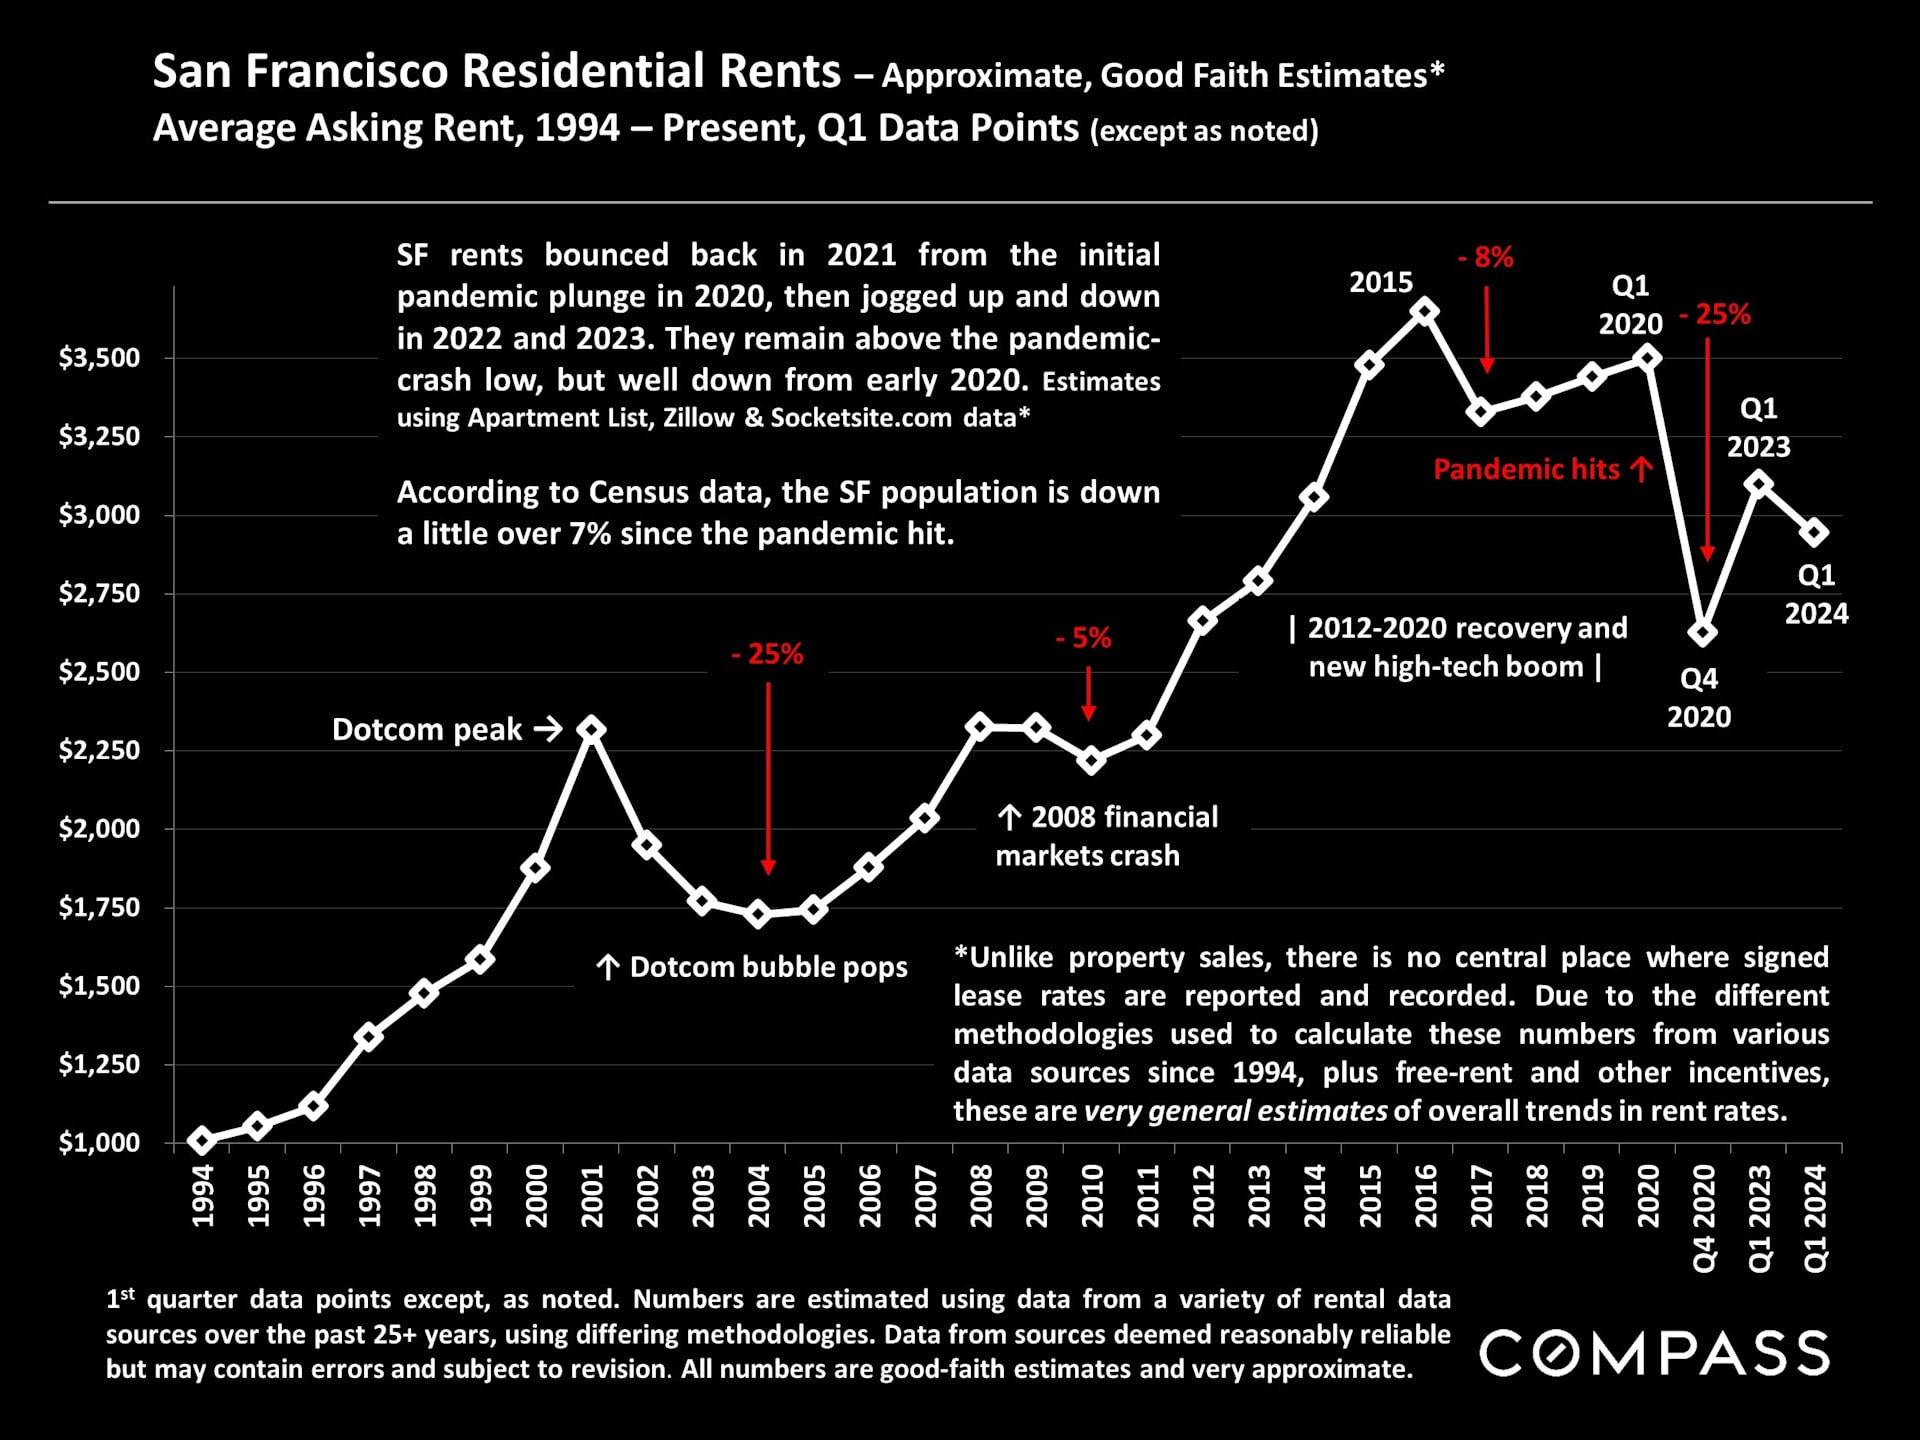
Chart of estimated San Francisco residential rents from 1994 through Q1 2024, with annotated economic shifts.

Real estate market statistics definitions, data caveats, and Compass legal disclaimer.

Work With Us

Cece Doricko San Francisco Real Estate specializes in luxury properties and has developed an incredible network to help you find the home of your dreams. Our well honed team of experts, preferred vendors, and Compass support will help prepare your home for the market with great efficiency to achieve the greatest value.